Open Access
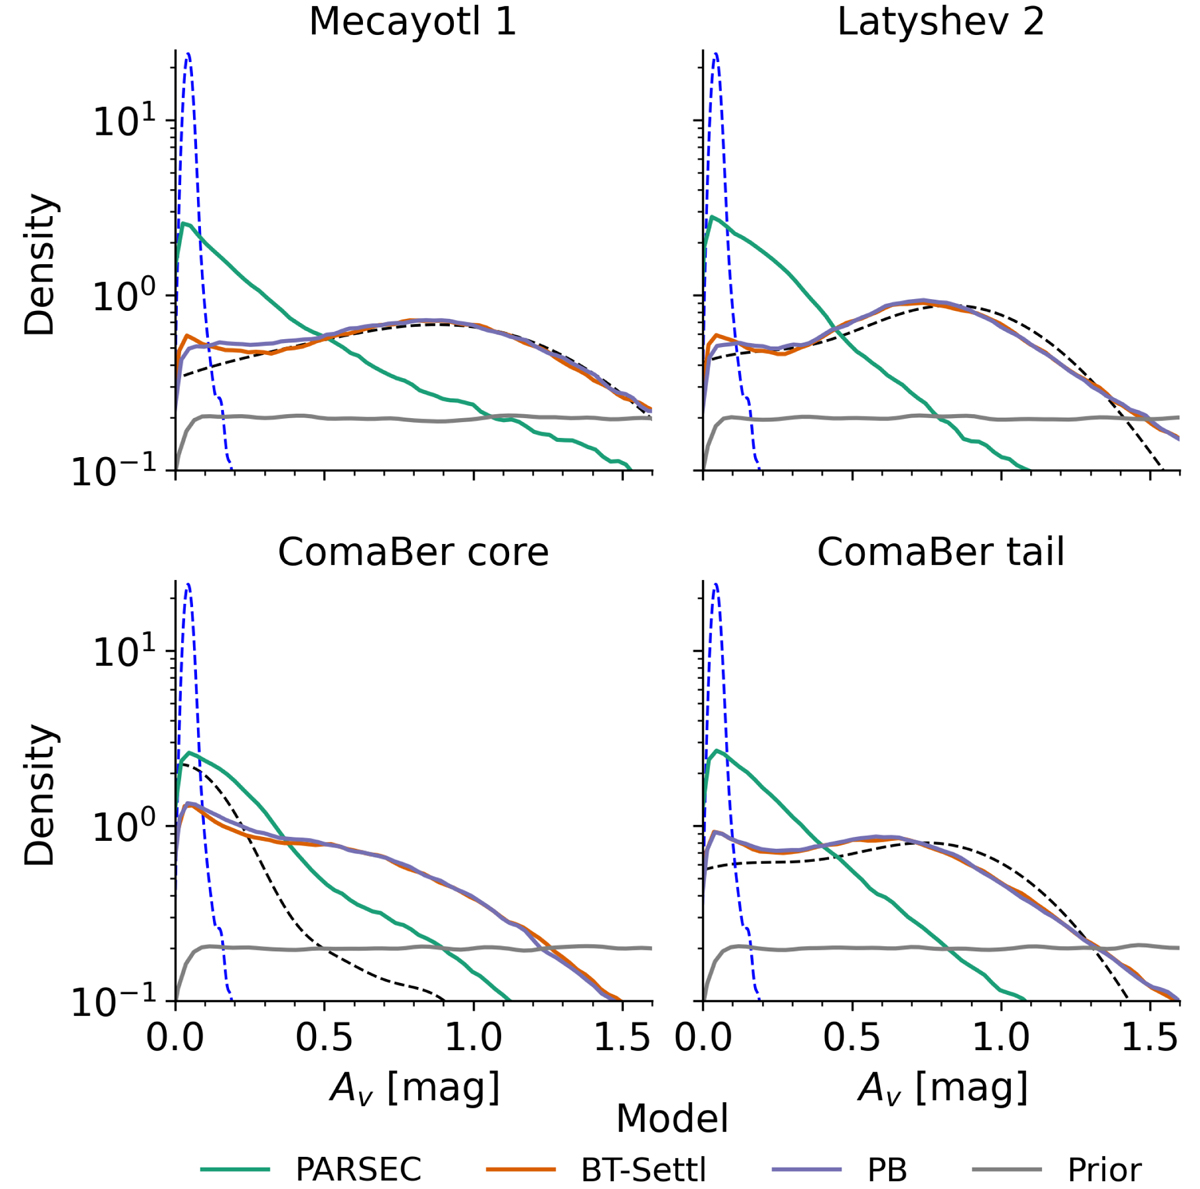
Fig. C.1.
Download original image
Distributions of Av as inferred using a uniform prior (Av ∈ [0, 10] mag, grey lines) and different theoretical models (colour coded legend). The black and blue dashed lines show the Av distributions of our candidate members as reported by Gaia DR3 and Planck Collaboration Int. XLVIII (2016), respectively.
Current usage metrics show cumulative count of Article Views (full-text article views including HTML views, PDF and ePub downloads, according to the available data) and Abstracts Views on Vision4Press platform.
Data correspond to usage on the plateform after 2015. The current usage metrics is available 48-96 hours after online publication and is updated daily on week days.
Initial download of the metrics may take a while.