Open Access
Fig. 1.
Download original image
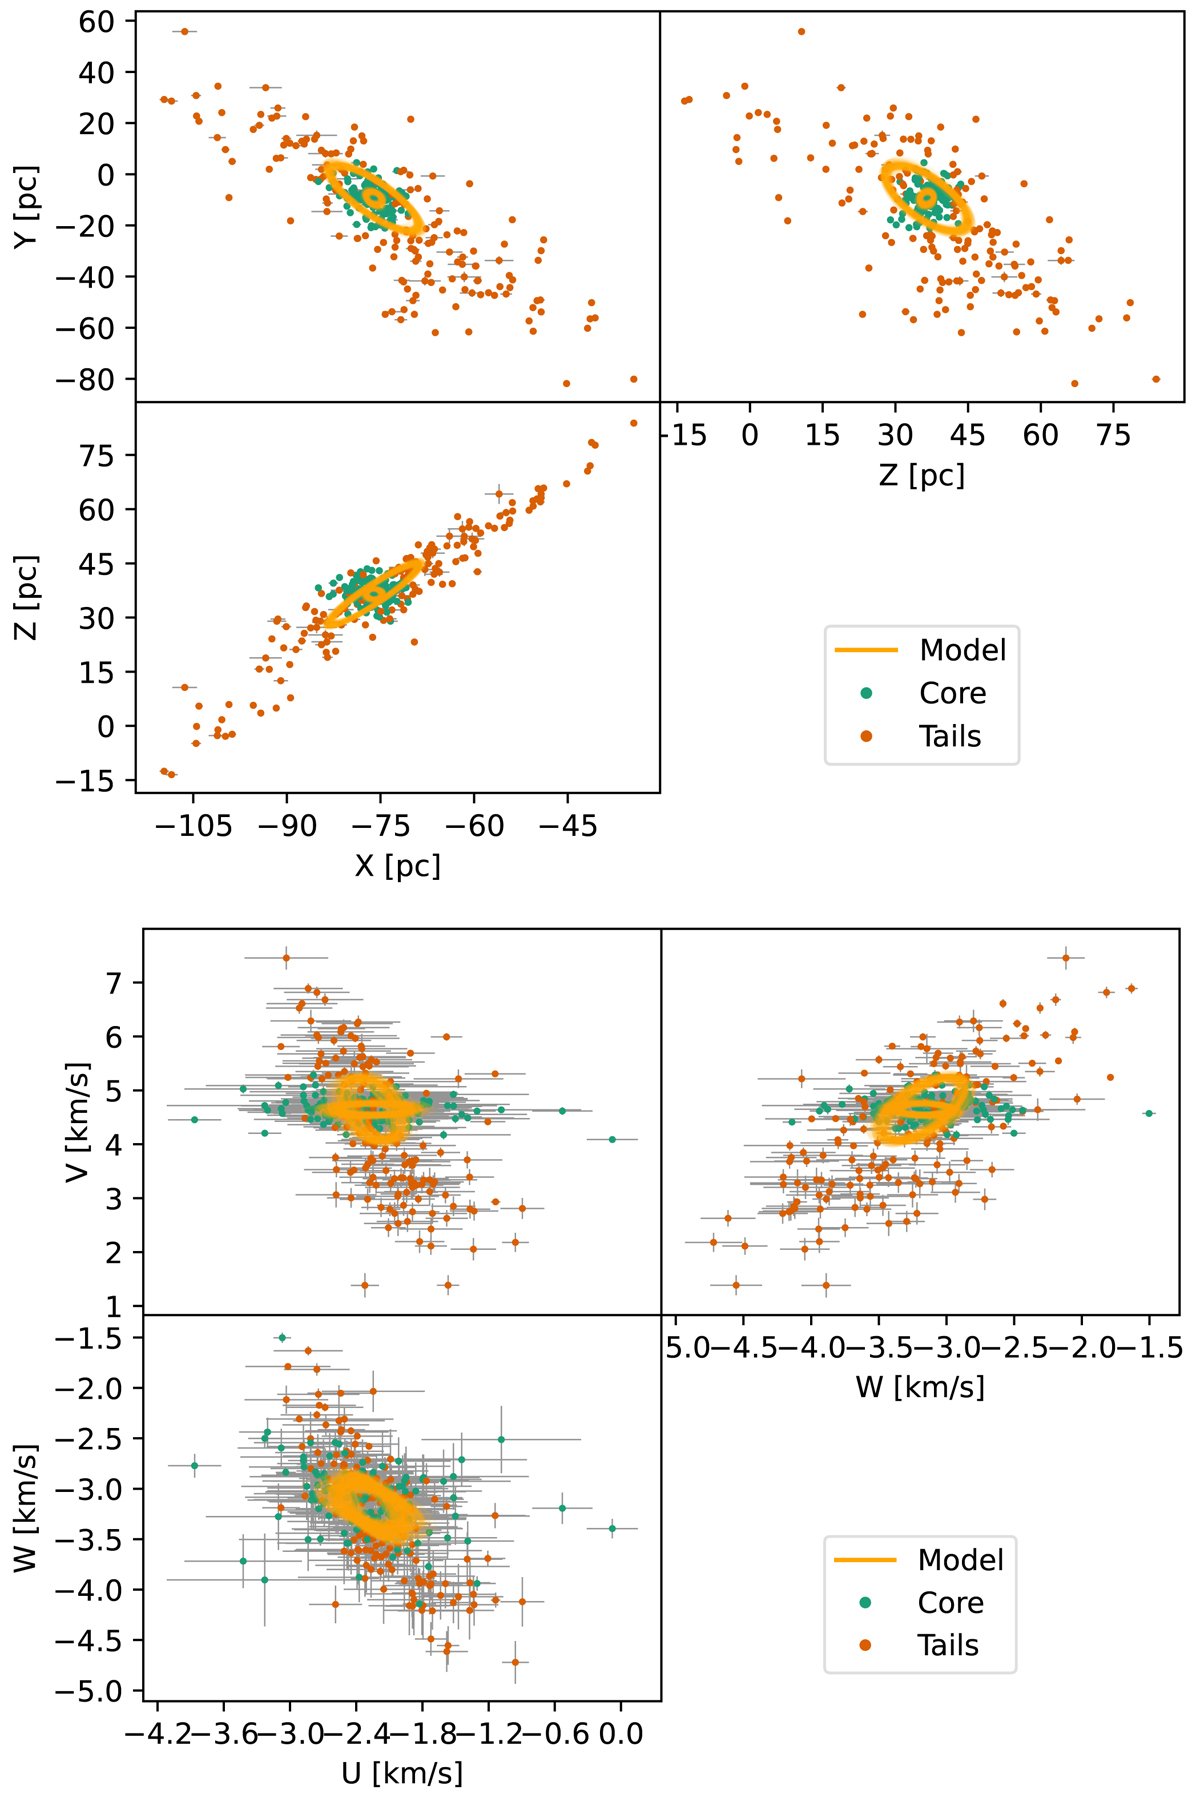
Positions (top panel) and velocities (bottom panel) of Coma Ber candidate members. The 100 orange lines show the posterior samples from the inferred group-level parameters while the dots and error bar depict the mean and standard deviation, respectively, of the inferred positions and velocities.
Current usage metrics show cumulative count of Article Views (full-text article views including HTML views, PDF and ePub downloads, according to the available data) and Abstracts Views on Vision4Press platform.
Data correspond to usage on the plateform after 2015. The current usage metrics is available 48-96 hours after online publication and is updated daily on week days.
Initial download of the metrics may take a while.