Fig. 6.
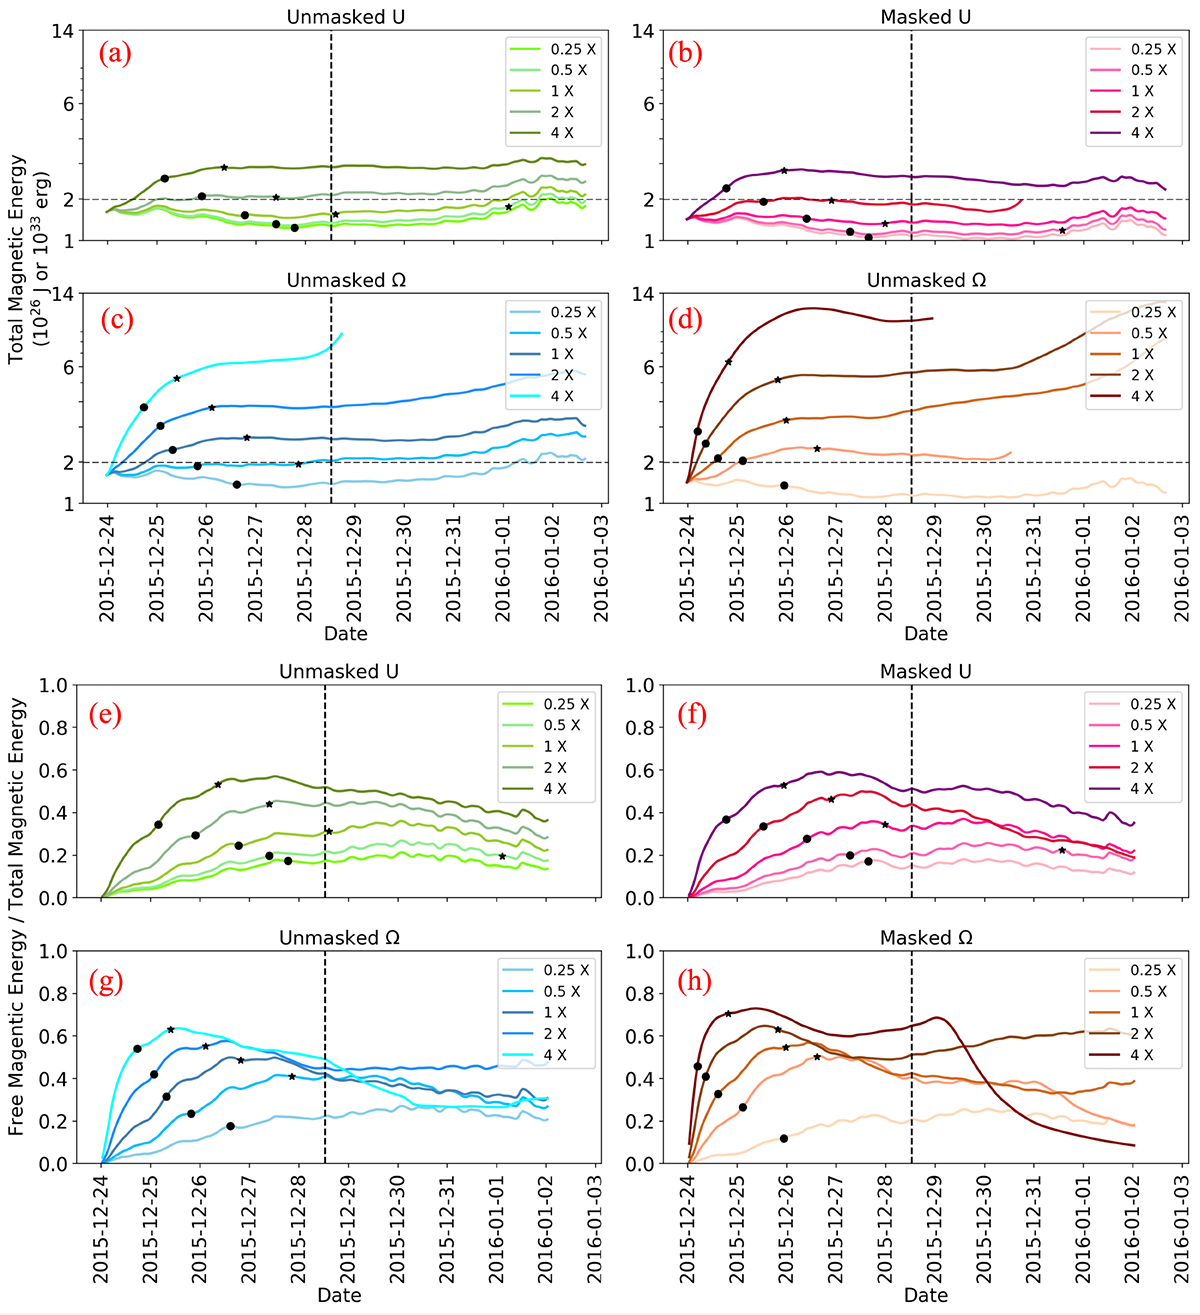
Download original image
Temporal evolution of total magnetic energy for AR 12473 from 23:36 UT on December 23, 2015 to the time the flux rope reached ≈100 Mm for various values of U and Ω using the processed simulation data (top panel). These are (a) the unmasked U-assumption, (b) the masked U-assumption, (c) the unmasked Ω-assumption, and (d) the masked Ω-assumption. The black dot and black star represent the flux rope formation time and the time when the flux rope reaches ≈100 Mm for various values of U and Ω. The free parameters in the non-inductive electric field values vary from 0.25× to 4× of the optimised values. Temporal evolution of the ratio of the free to the total magnetic energy (bottom panel). The vertical dashed line is the M1.9 class flare peak time on December 28, 2015.
Current usage metrics show cumulative count of Article Views (full-text article views including HTML views, PDF and ePub downloads, according to the available data) and Abstracts Views on Vision4Press platform.
Data correspond to usage on the plateform after 2015. The current usage metrics is available 48-96 hours after online publication and is updated daily on week days.
Initial download of the metrics may take a while.