Fig. 5
Download original image
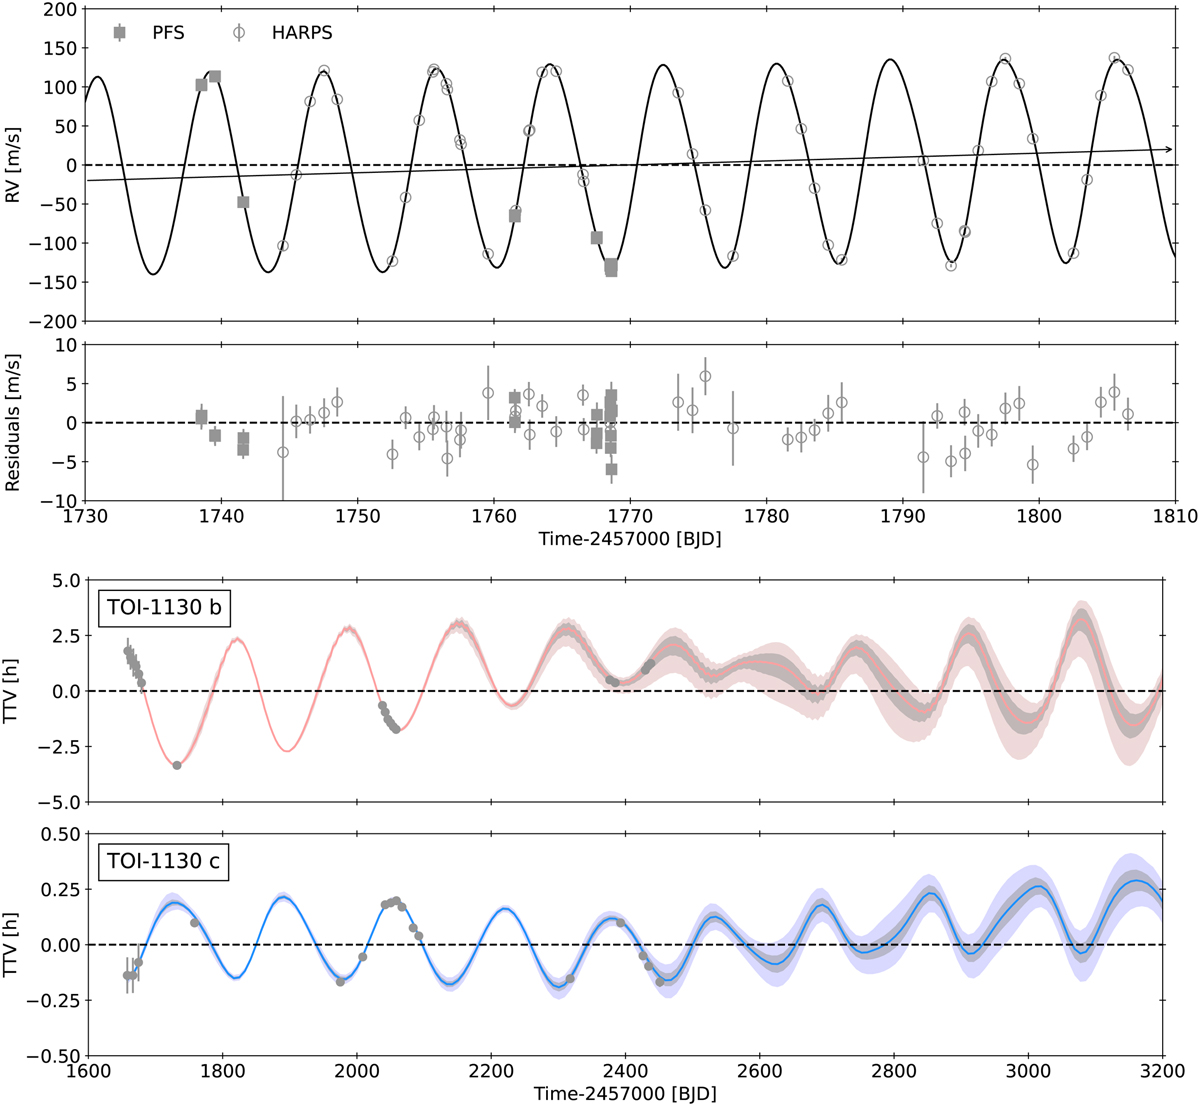
RV time series (upper panel) for TOI-1130 where the open circles and filled squares mark the data from HARPS and PFS, respectively. The best-fit PyTTV model (see Sect. 3.5) is overplotted in black. The data show a clear linear trend which is marked by the black arrow. RV residuals are shown in the second panel. Posterior TTV model (lower panels) from the photodynamical modeling of TOI-1130 b (third panel) and TOI-1130 c (fourth panel) with PyTTV (see Sect. 3.5). The solid salmon and blue colored lines mark the median of the posterior pdf while the shaded areas in grey and in light blue and pink show the 1x and 3x ranges for TOI-1130 b and TOI-1130 c, respectively. The TTVs with their individual uncertainties measured by fitting each transit center as an independent free parameter with PyTTV (Sect. 3.4) are shown in grey for comparison. The dashed lines mark the subtracted mean orbital period of 4.079±0.022 days with an ephemeris of 2 458 658.66924 ± 0.00020 days, and of 8.3495±0.0027 days with an ephemeris of 2 458 657.910329 ± 0.000046 days, respectively, for TOI-1130 b and c.
Current usage metrics show cumulative count of Article Views (full-text article views including HTML views, PDF and ePub downloads, according to the available data) and Abstracts Views on Vision4Press platform.
Data correspond to usage on the plateform after 2015. The current usage metrics is available 48-96 hours after online publication and is updated daily on week days.
Initial download of the metrics may take a while.