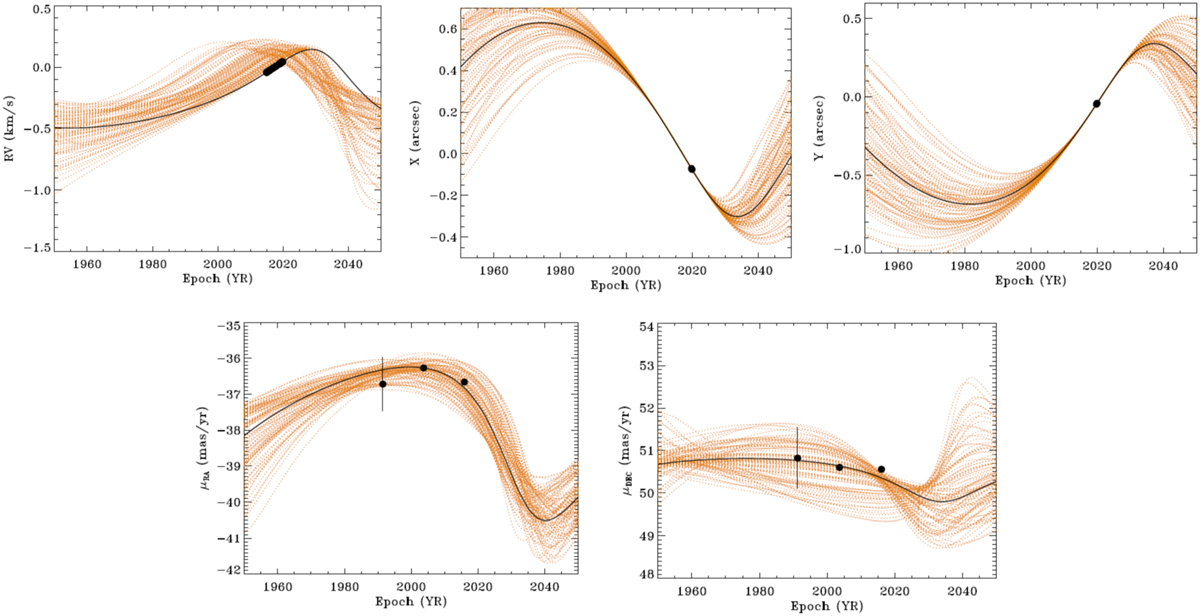
Fig. 11
Download original image
RV, sky position, and motion on the sky for the long-period solution resulting from the MCMC described in the text. The black line shows the nominal best-fit solution. The dashed orange lines represent a random selection of orbital solutions drawn from the posterior distributions of the model parameters from the DE-MCMC analysis. The black dots are the observational data from HARPS (RV panel), SPHERE (X and Y panels), and Gaia and HIPPARCOS (proper motion panels).
Current usage metrics show cumulative count of Article Views (full-text article views including HTML views, PDF and ePub downloads, according to the available data) and Abstracts Views on Vision4Press platform.
Data correspond to usage on the plateform after 2015. The current usage metrics is available 48-96 hours after online publication and is updated daily on week days.
Initial download of the metrics may take a while.