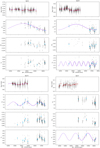
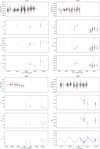
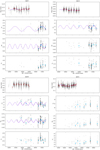
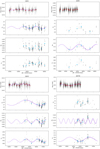
Fig. F.2

Download original image
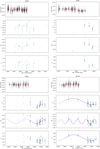
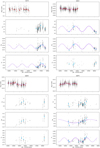
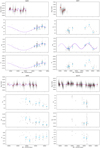
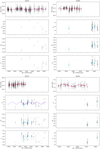
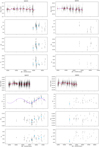
Photometric and chromospheric (Ca, Na, and Hα) time series for the 43 stars with a fitted sinusoidal model (see Table 2). Average photometry in 100-day bins is shown in red. Average chromospheric indices over seasons (see Sect. 2.5) are shown in blue. The represented models (in purple) were obtained on the whole temporal span: the time range where the model is best constrained is shown as the solid line, and the time range in which it is poorly constrained is shown as the dashed line. Some of the photometric time series were fitted by two sinusoidal components (see Table 2 and Sect. 3.5).
Current usage metrics show cumulative count of Article Views (full-text article views including HTML views, PDF and ePub downloads, according to the available data) and Abstracts Views on Vision4Press platform.
Data correspond to usage on the plateform after 2015. The current usage metrics is available 48-96 hours after online publication and is updated daily on week days.
Initial download of the metrics may take a while.