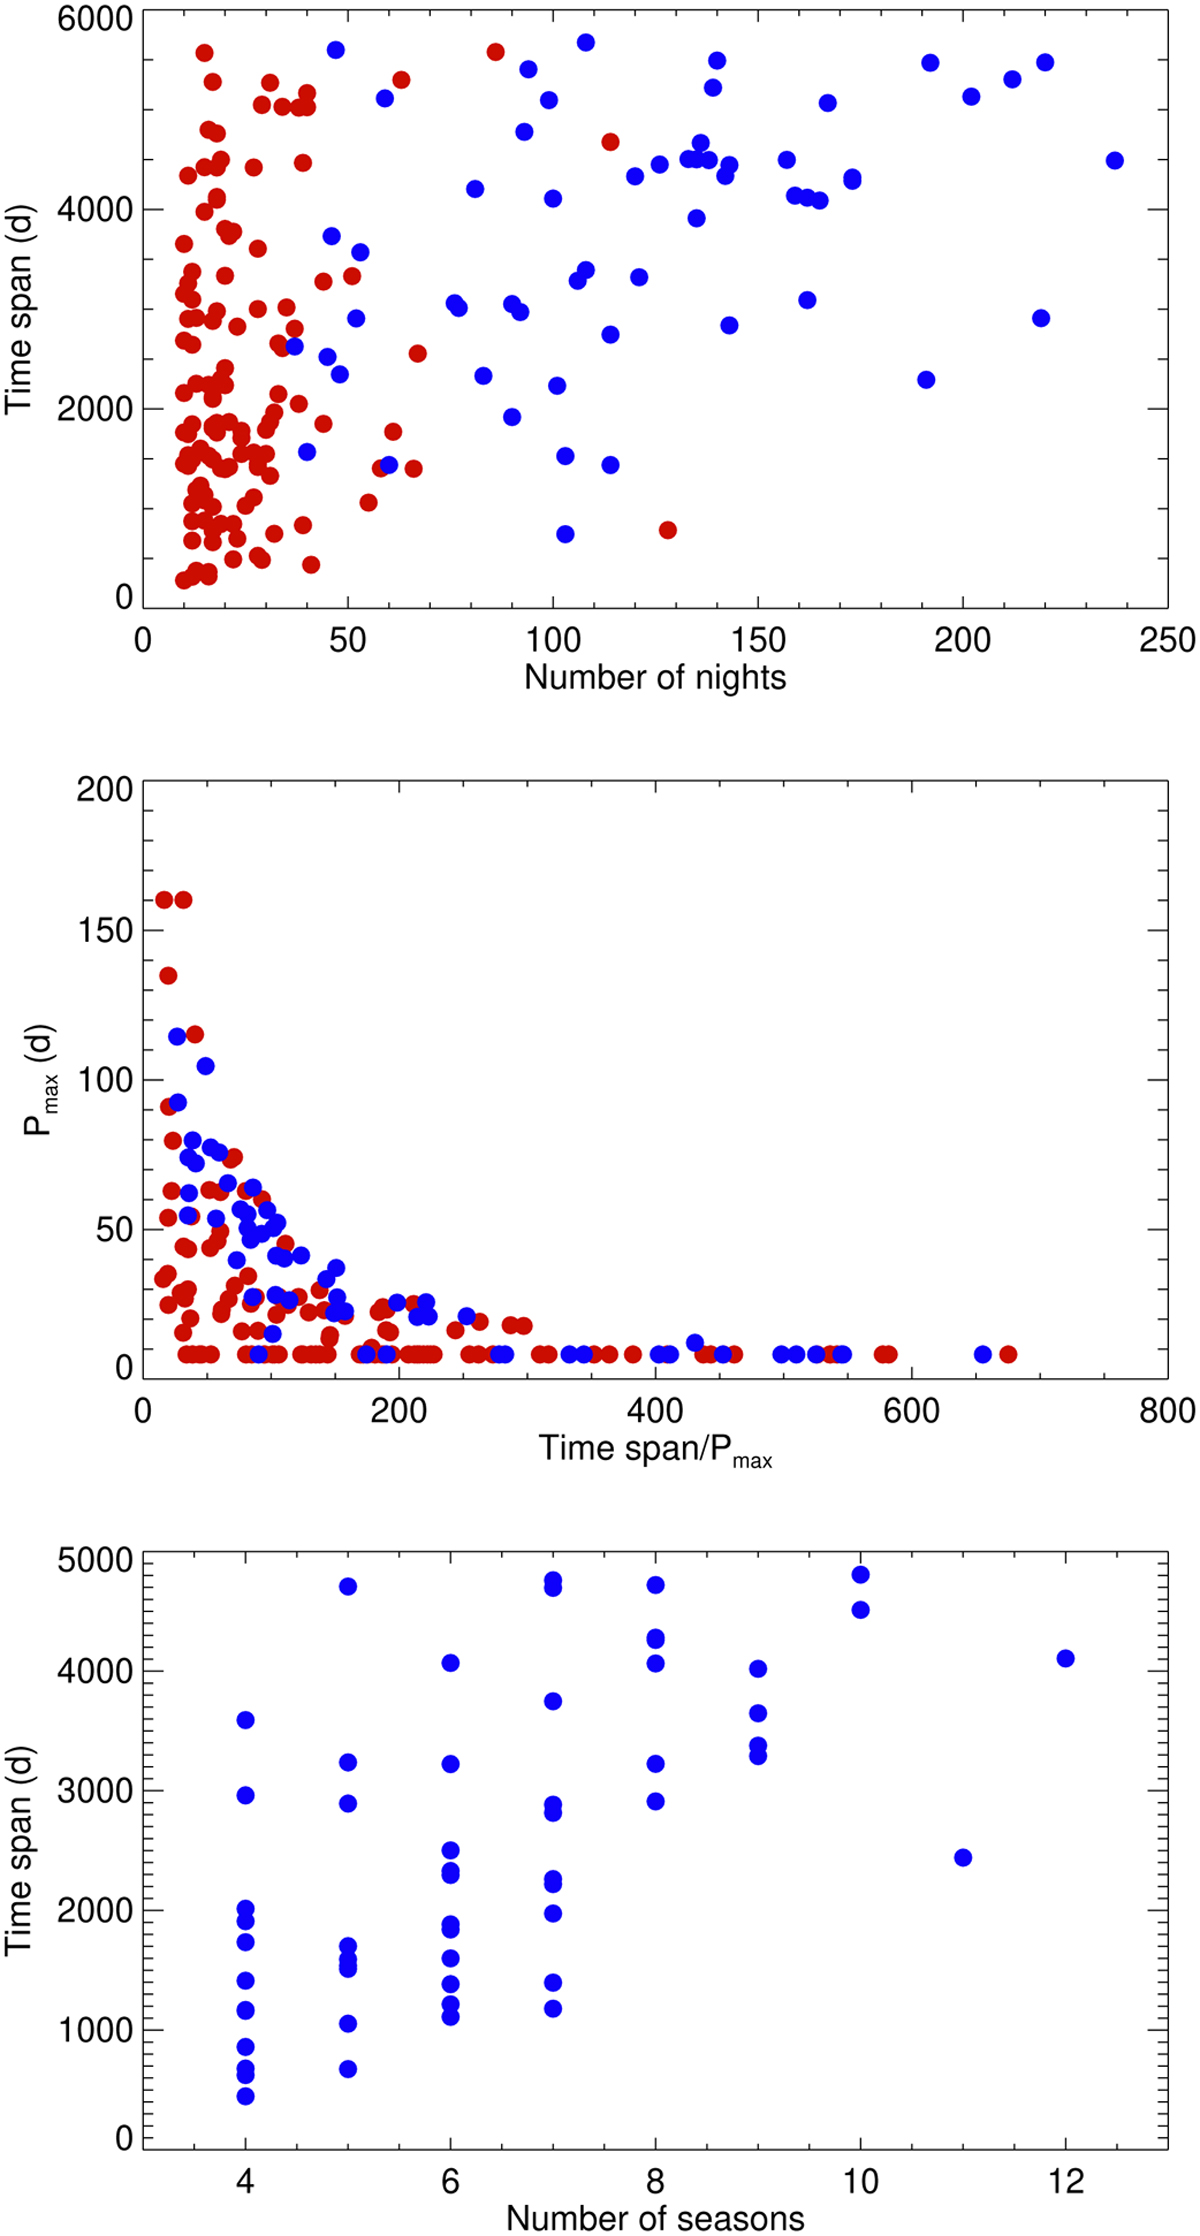
Fig. 3
Download original image
Temporal coverage vs. number of independent nights with observations (upper panel), maximum rotational period (Pmax) vs. ratio of the time span and Pmax (middle panel), and temporal coverage vs. number of independent seasons with observations for the season sub-sample (lower panel). In the two first panels, the season sub-sample is shown in blue, and all other stars in our sample are shown in red.
Current usage metrics show cumulative count of Article Views (full-text article views including HTML views, PDF and ePub downloads, according to the available data) and Abstracts Views on Vision4Press platform.
Data correspond to usage on the plateform after 2015. The current usage metrics is available 48-96 hours after online publication and is updated daily on week days.
Initial download of the metrics may take a while.