Fig. 10.
Download original image
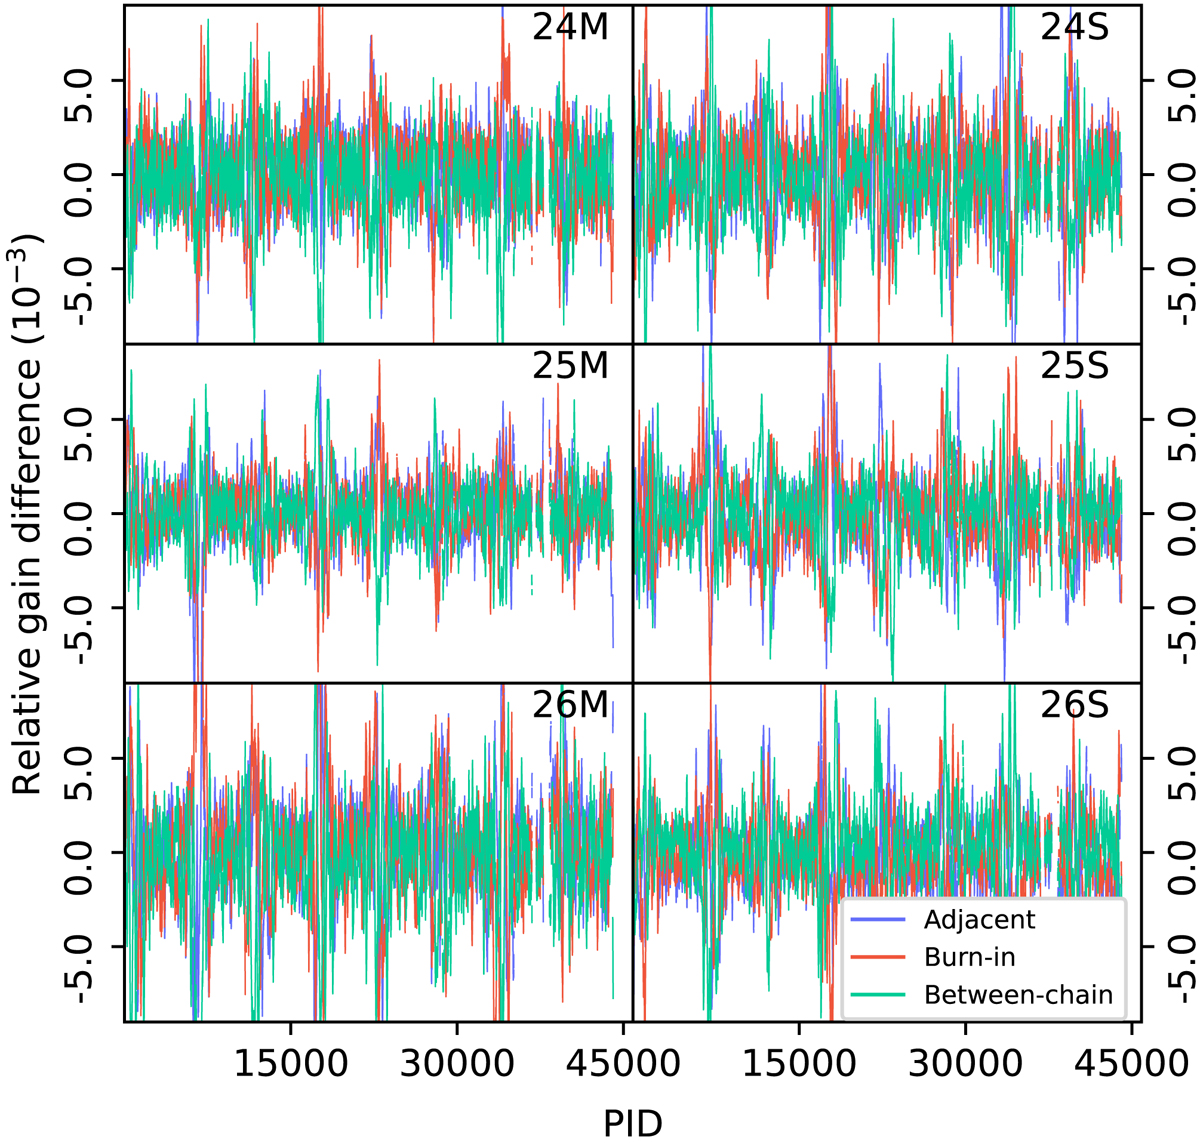
Relative differences between the last sample in one of the BEYONDPLANCK chains and the sample adjacent to the last sample (blue line), the initial sample (the burn-in difference; red line) and the last sample in another chain (green line), for selected detectors.
Current usage metrics show cumulative count of Article Views (full-text article views including HTML views, PDF and ePub downloads, according to the available data) and Abstracts Views on Vision4Press platform.
Data correspond to usage on the plateform after 2015. The current usage metrics is available 48-96 hours after online publication and is updated daily on week days.
Initial download of the metrics may take a while.