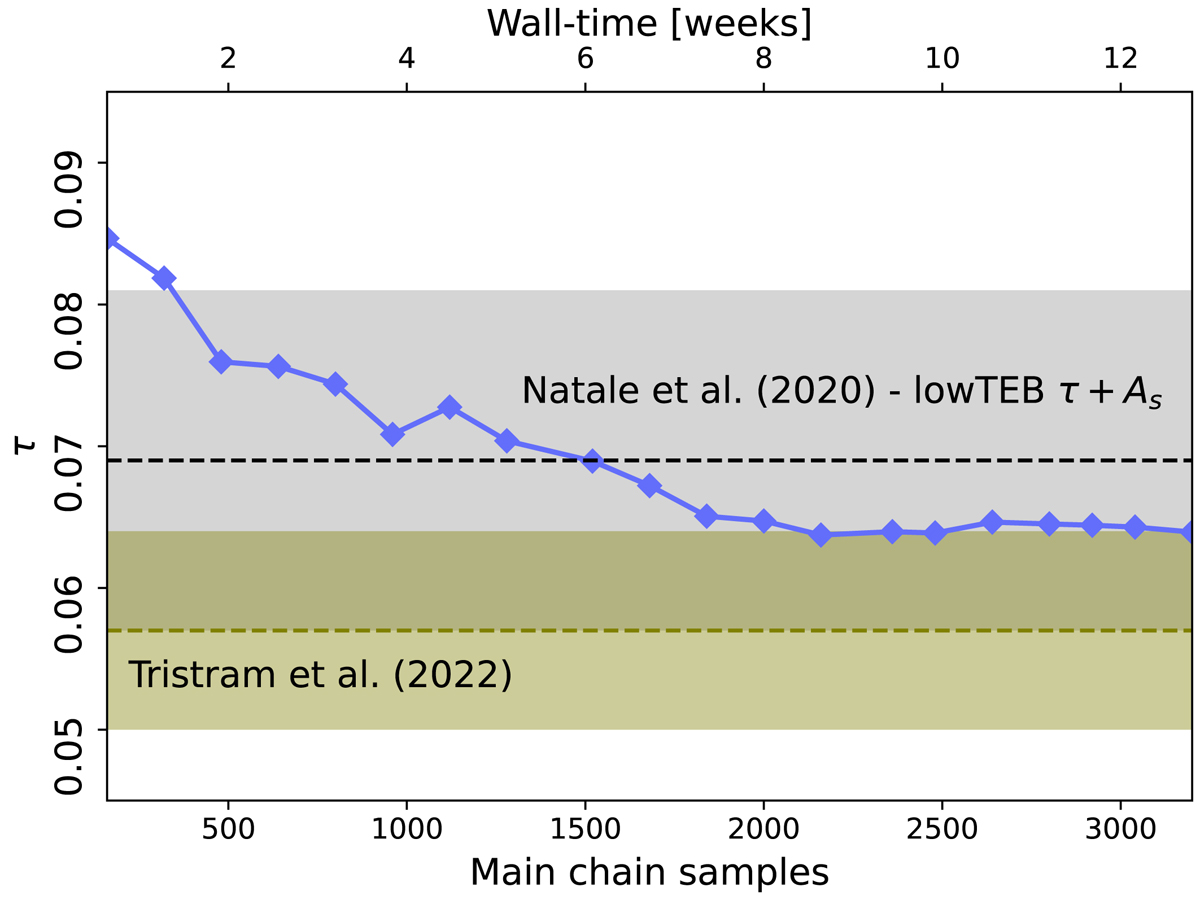
Fig. 7.
Download original image
Convergence of constraints of the reionization optical depth as a function of the number of main chain samples used to construct the CMB mean map and covariance matrix and the relative wall time needed to produce such samples in the main Gibbs loop. The solid blue line shows the posterior mean for τ, while the gray and green regions show the corresponding 68% confidence interval for Natale et al. (2020) and Tristram et al. (2022), respectively.
Current usage metrics show cumulative count of Article Views (full-text article views including HTML views, PDF and ePub downloads, according to the available data) and Abstracts Views on Vision4Press platform.
Data correspond to usage on the plateform after 2015. The current usage metrics is available 48-96 hours after online publication and is updated daily on week days.
Initial download of the metrics may take a while.