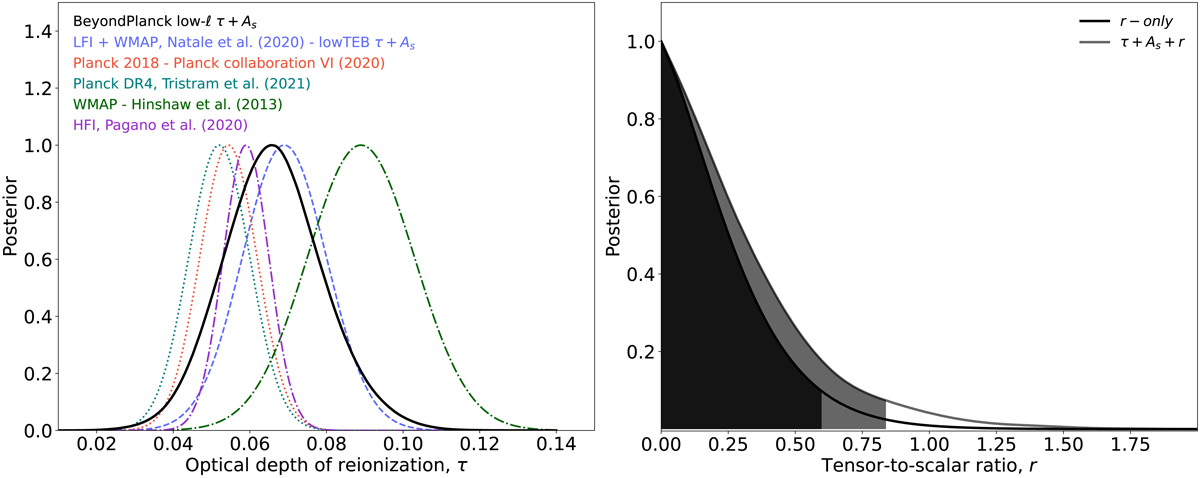
Fig. 4.
Download original image
Comparison of marginal posterior distributions of the reionization optical depth from Planck 2018, shown on the left (red, dotted; Planck Collaboration VI 2020), 9-yr WMAP (green, dot-dashed; Hinshaw et al. 2013), Planck DR4 (cyan, dotted; Tristram et al. 2022), Planck HFI (purple, dot-dashed; Pagano et al. 2020), WMAP Ka–V and LFI 70 GHz (fitting τ + As; Natale et al. 2020; blue, dashed); and BEYONDPLANCK using multipoles ℓ = 2–8, marginalized over the scalar amplitude As (black). Corresponding marginal BEYONDPLANCK tensor-to-scalar ratio posteriors derived using BB multipoles between ℓ = 2–8, marginalized over the scalar amplitude As (gray), and by fixing all the ΛCDM parameters to their best-fit values, shown on the right (black). The filled region corresponds to the 95% confidence interval.
Current usage metrics show cumulative count of Article Views (full-text article views including HTML views, PDF and ePub downloads, according to the available data) and Abstracts Views on Vision4Press platform.
Data correspond to usage on the plateform after 2015. The current usage metrics is available 48-96 hours after online publication and is updated daily on week days.
Initial download of the metrics may take a while.