Fig. 9
Download original image
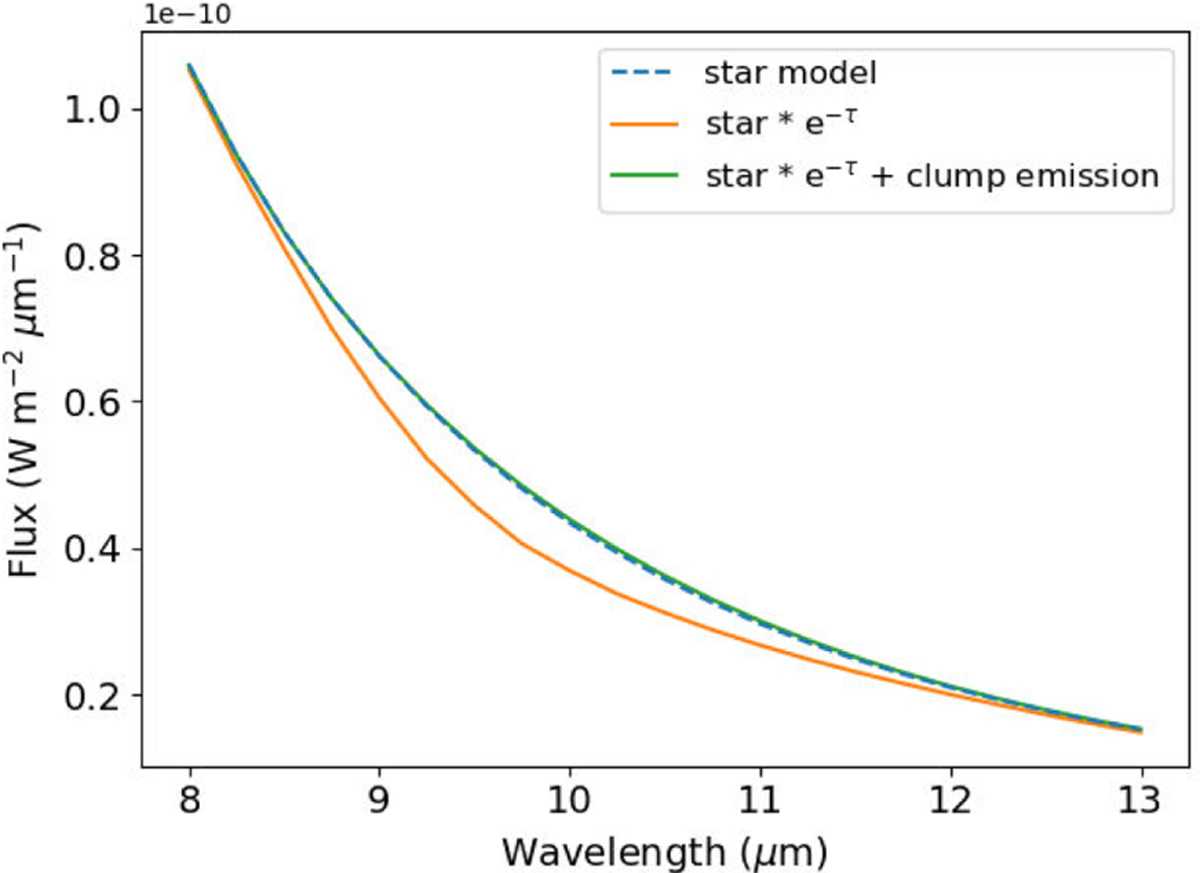
SED (blue dashed line, computed from the RADMC3D images outputted at different wavelengths) of the star with no dust. The orange line shows the SED of the star after each image was multiplied by the transmittance map, T = e−τ where τ is the optical depth, caused by the dust clump in the line of sight. Adding the dust clump emission to these new images results in the green line, which almost overlaps with the blue dashed line.
Current usage metrics show cumulative count of Article Views (full-text article views including HTML views, PDF and ePub downloads, according to the available data) and Abstracts Views on Vision4Press platform.
Data correspond to usage on the plateform after 2015. The current usage metrics is available 48-96 hours after online publication and is updated daily on week days.
Initial download of the metrics may take a while.