Fig. 7
Download original image
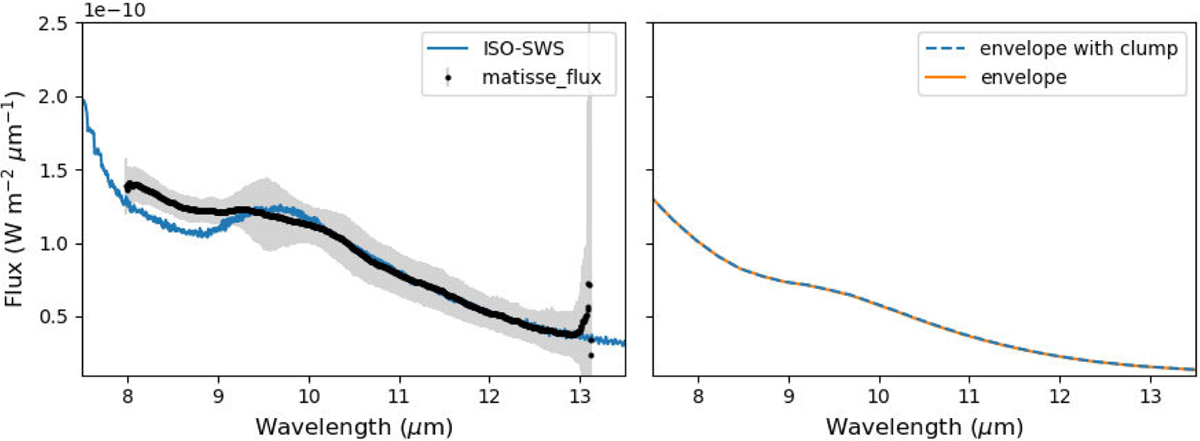
Observed SEDs of Betelgeuse compared with the RADMC3D modelling. Left: spectral energy distribution from ISO-SWS01 taken pre-dimming (1997 October 08, see Sect. 2 for details) shown in blue and MATISSE shown in black (error bars shown in grey). Right: comparison of RADMC3D dust shell models, one with a clump positioned in front of the star and one without.
Current usage metrics show cumulative count of Article Views (full-text article views including HTML views, PDF and ePub downloads, according to the available data) and Abstracts Views on Vision4Press platform.
Data correspond to usage on the plateform after 2015. The current usage metrics is available 48-96 hours after online publication and is updated daily on week days.
Initial download of the metrics may take a while.