Fig. 5
Download original image
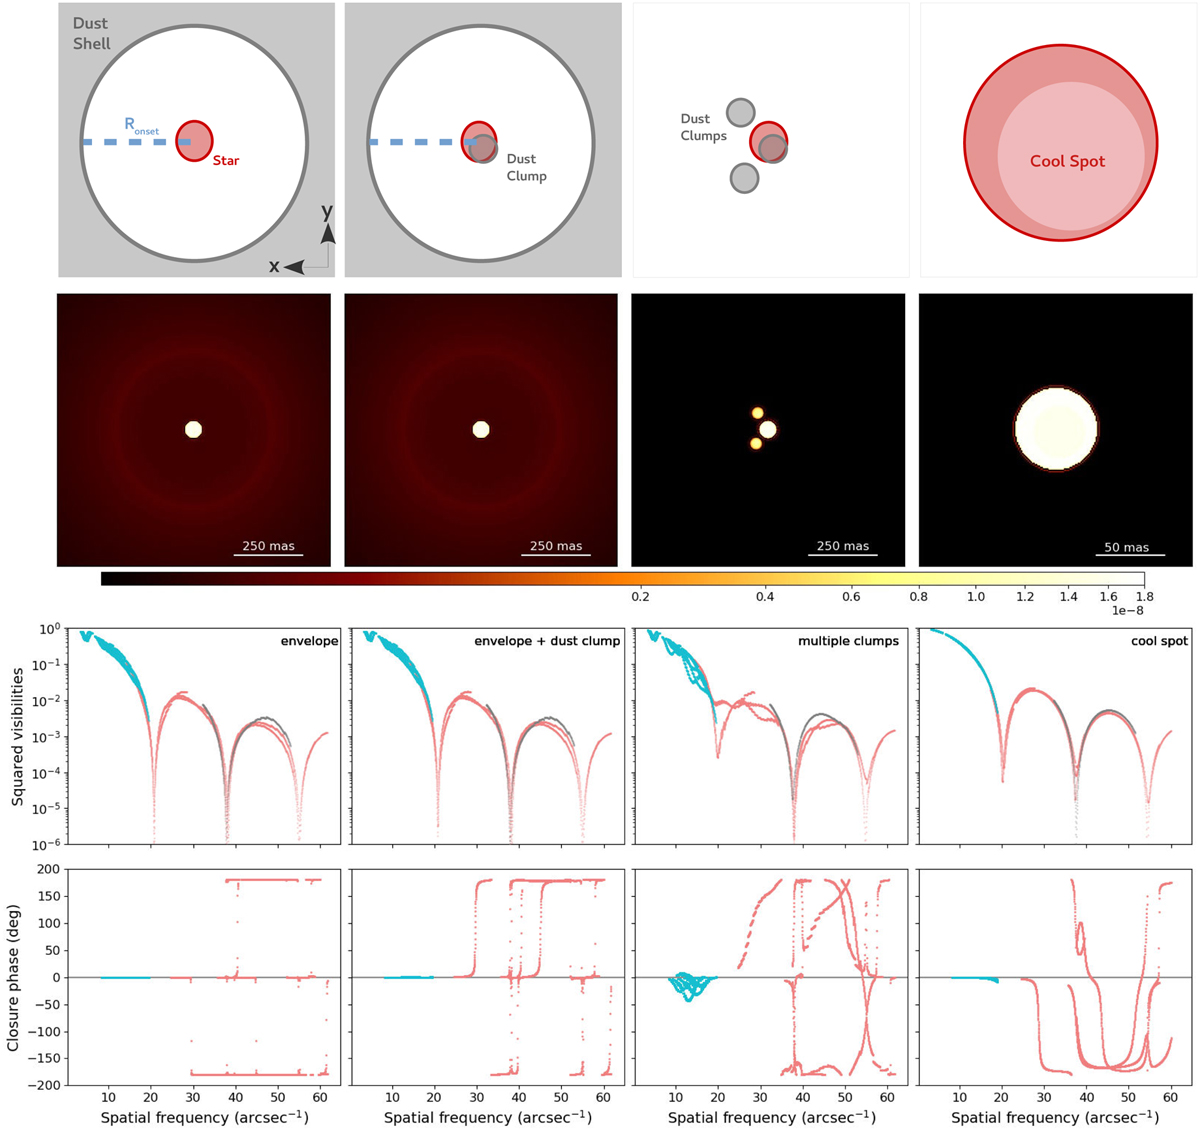
Comparison of the various models detailed in the main text with the MATISSE observables of Betelgeuse during the Great Dimming. First row: schematics of the different model setups (not to scale). Second row: intensity images (W m−2 µm−1 arcsec−2) output from RADMC3D at 10 µm for the three dust setups and one for the composite PHOENIX models representing the cool spot. The intensity is scaled with a power law with exponent 0.3 to best show the contribution of the different model elements. The image depicting the cool spot has been zoomed in on to better show the stellar disk (see legend for spatial scale used). Third row: squared visibilities from each of the models in small (blue), medium (pink), and large (grey) configurations. Bottom row: Closure phase for each of the models.
Current usage metrics show cumulative count of Article Views (full-text article views including HTML views, PDF and ePub downloads, according to the available data) and Abstracts Views on Vision4Press platform.
Data correspond to usage on the plateform after 2015. The current usage metrics is available 48-96 hours after online publication and is updated daily on week days.
Initial download of the metrics may take a while.