Fig. 5.
Download original image
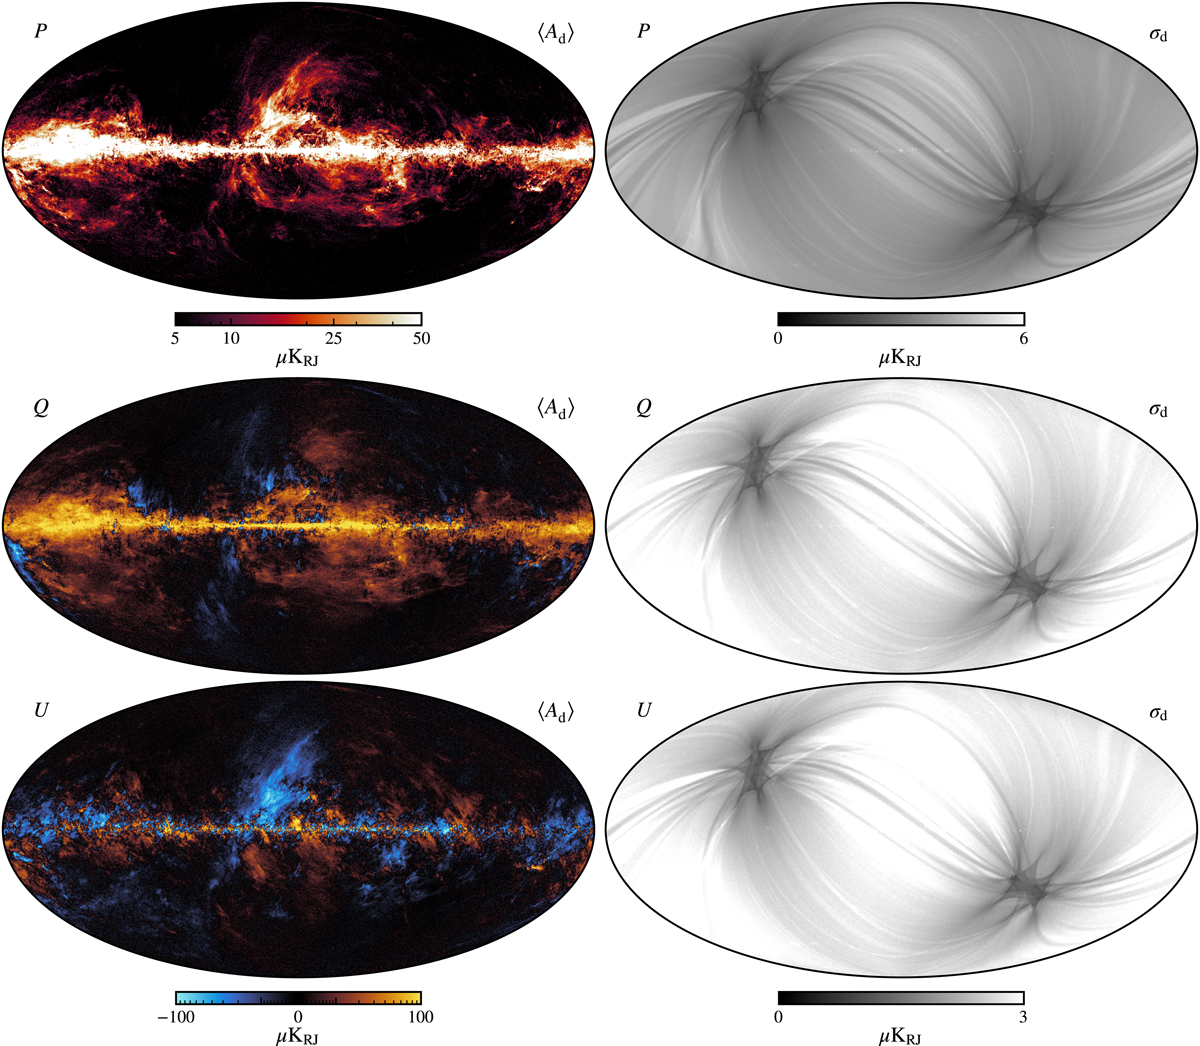
Polarized thermal dust amplitude maps (left column) plotted in terms of the polarization amplitude ![]() (top row) and the Stokes Q (middle row) and U parameters (bottom row). Corresponding posterior standard deviation maps (right column). All maps are evaluated at a reference frequency of 353 GHz in units of μKRJ and averaged over all available Gibbs samples. The effective angular resolution is 10′ FWHM.
(top row) and the Stokes Q (middle row) and U parameters (bottom row). Corresponding posterior standard deviation maps (right column). All maps are evaluated at a reference frequency of 353 GHz in units of μKRJ and averaged over all available Gibbs samples. The effective angular resolution is 10′ FWHM.
Current usage metrics show cumulative count of Article Views (full-text article views including HTML views, PDF and ePub downloads, according to the available data) and Abstracts Views on Vision4Press platform.
Data correspond to usage on the plateform after 2015. The current usage metrics is available 48-96 hours after online publication and is updated daily on week days.
Initial download of the metrics may take a while.