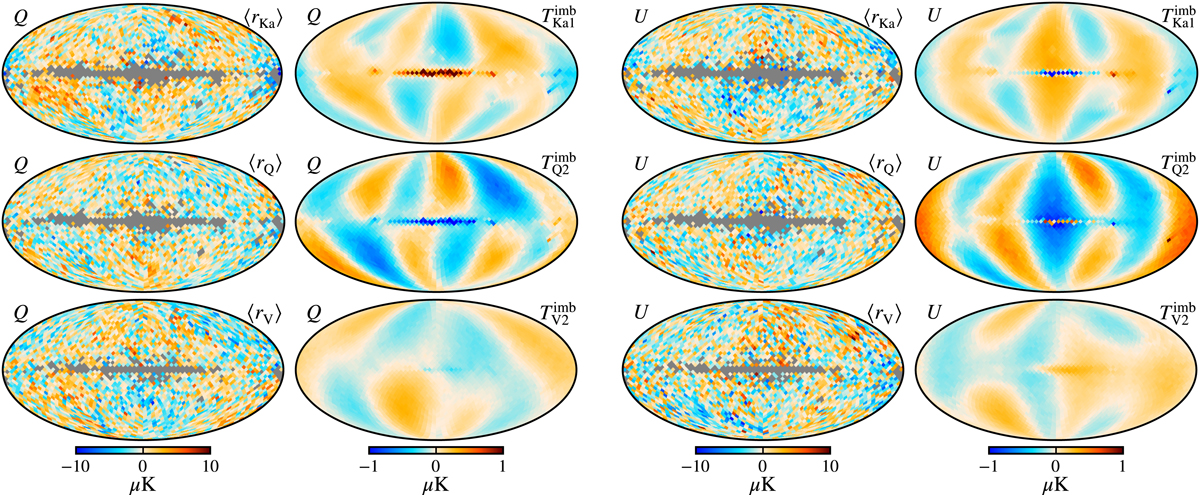
Fig. 4.
Download original image
Posterior mean total data-minus-model residual maps (rν = dν − sν) in Q (first column) and U (third column) for all included WMAP bands in the two left-most columns, at Nside = 16, masked with the processing mask applied in the pipeline. The second and fourth columns show corresponding transmission imbalance template maps for one of the differencing assemblies (e.g., Q{1, 2}, V{1, 2}) per residual as derived by Jarosik et al. (2007); we note that these templates are each associated with an unknown scaling amplitude that may take either sign.
Current usage metrics show cumulative count of Article Views (full-text article views including HTML views, PDF and ePub downloads, according to the available data) and Abstracts Views on Vision4Press platform.
Data correspond to usage on the plateform after 2015. The current usage metrics is available 48-96 hours after online publication and is updated daily on week days.
Initial download of the metrics may take a while.