Fig. 4.
Download original image
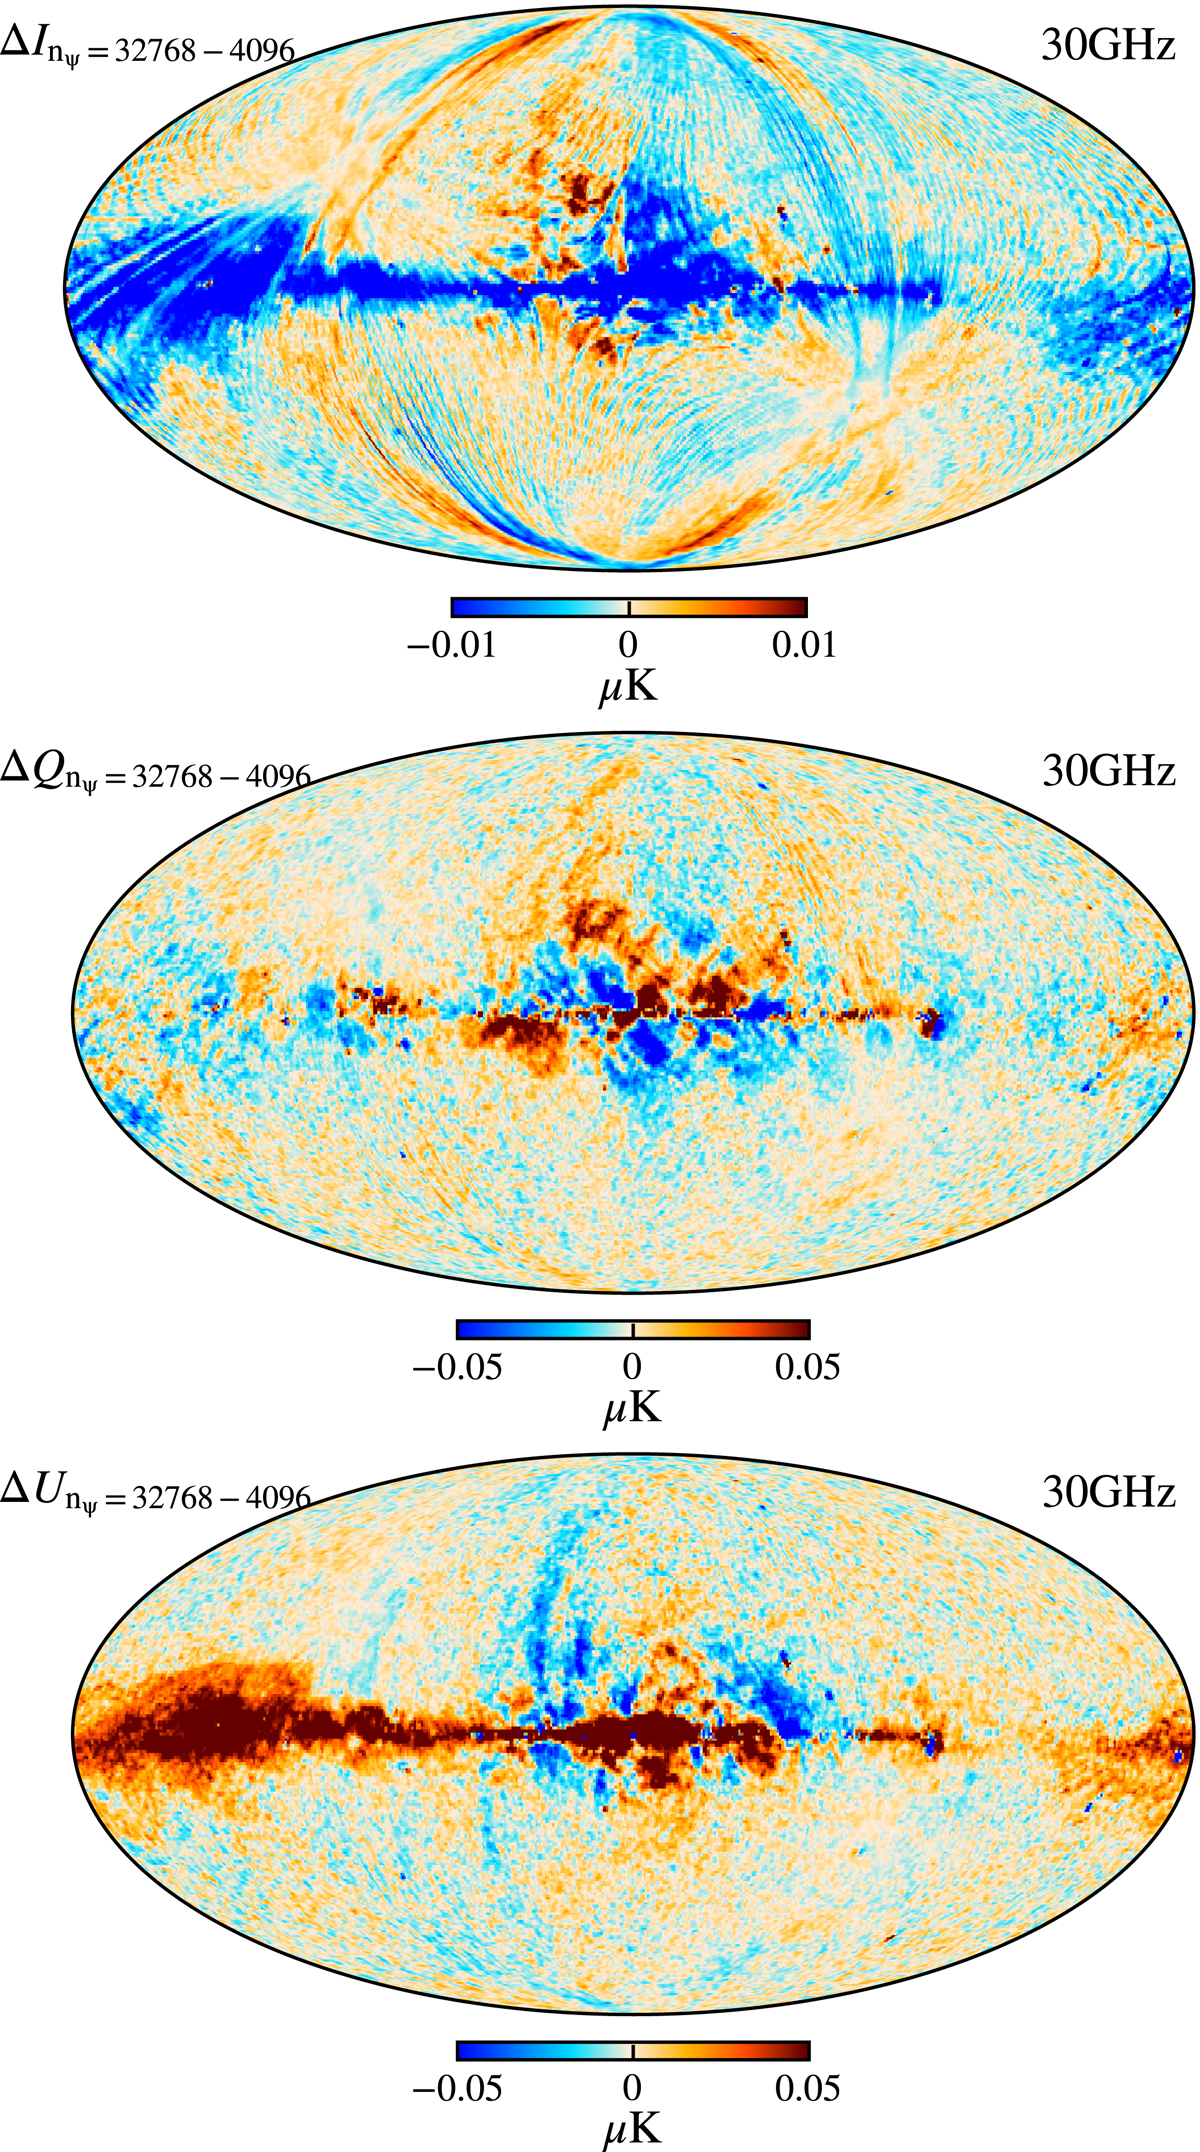
30 GHz T, Q, and U map differences between two pipeline executions using different levels of compression (nψ = 32 768 and nψ = 4096), smoothed by a 1° beam. The differences in temperature look like correlated noise, and in polarization we have some leakage from polarized synchrotron. In both cases, the amplitude of the differences is much lower than the uncertainties from other effects.
Current usage metrics show cumulative count of Article Views (full-text article views including HTML views, PDF and ePub downloads, according to the available data) and Abstracts Views on Vision4Press platform.
Data correspond to usage on the plateform after 2015. The current usage metrics is available 48-96 hours after online publication and is updated daily on week days.
Initial download of the metrics may take a while.