Fig. 5.
Download original image
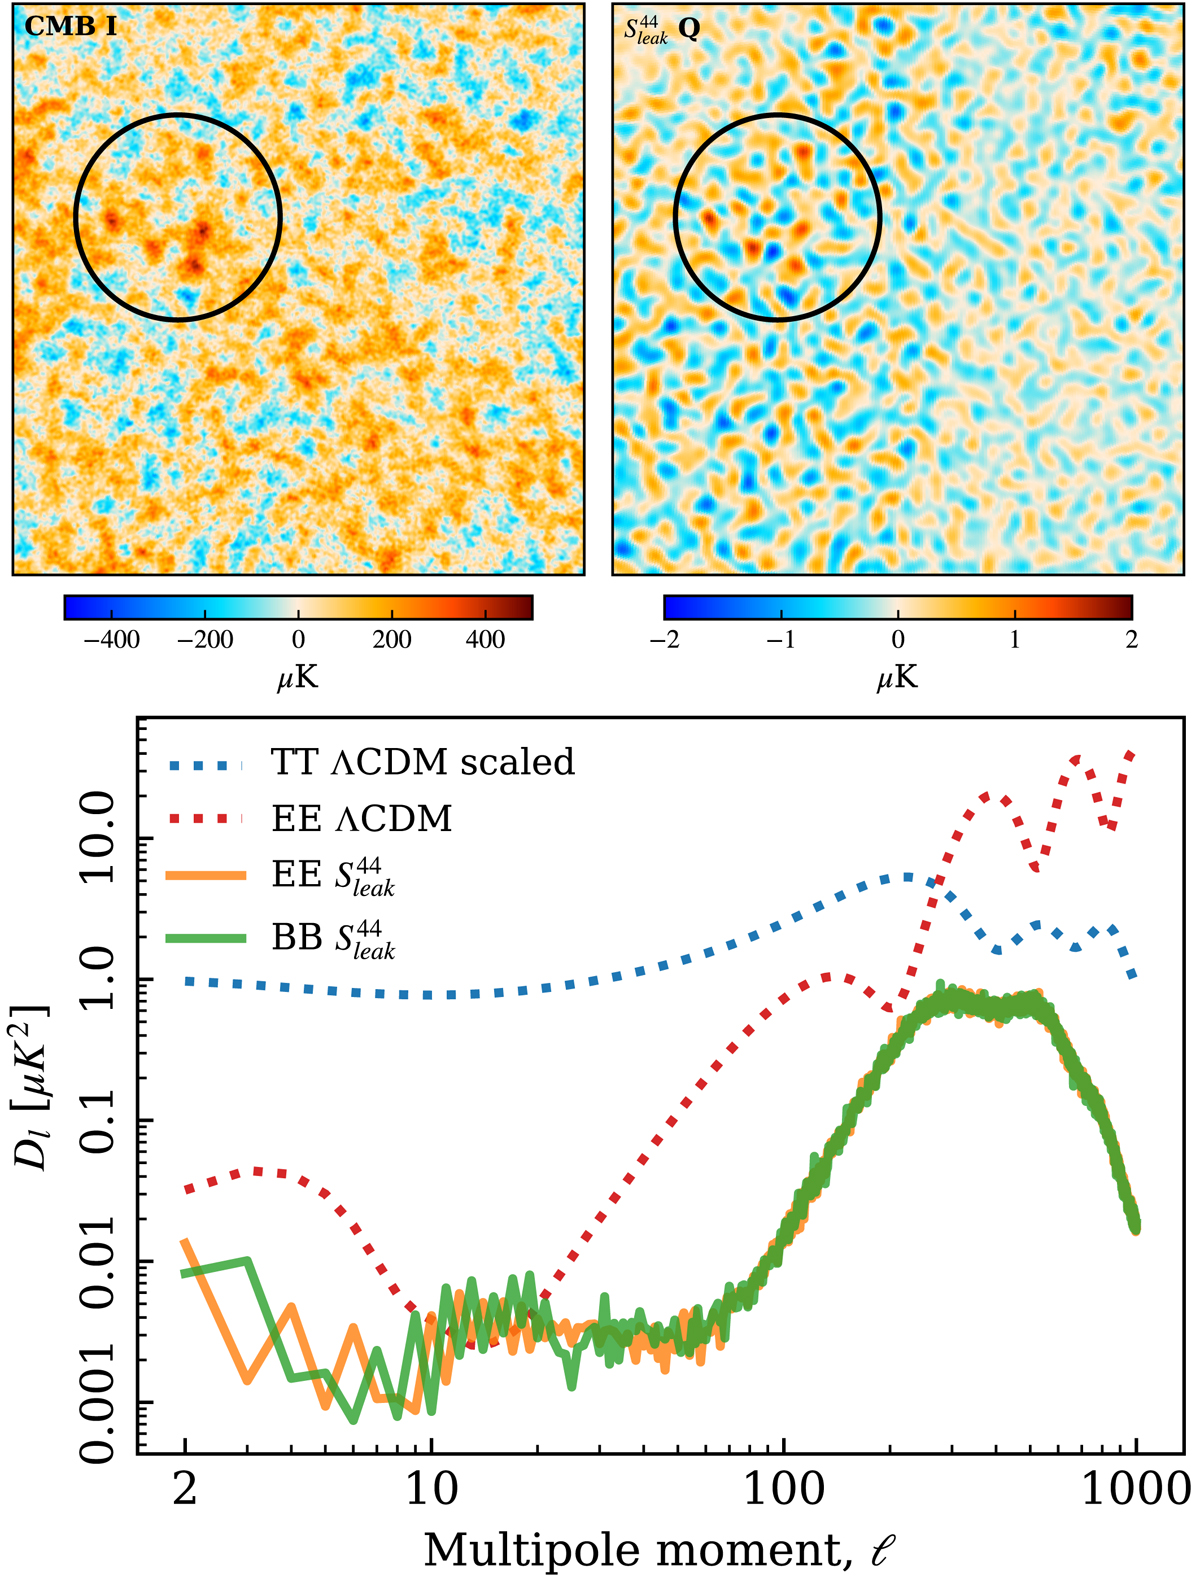
Top left: Gnomonic projection of a 30 ° ×30° area centered on (l, b)=(0 ° , − 70 ° ) in the BEYONDPLANCK posterior mean CMB temperature map (Colombo et al. 2023). Top right: BEYONDPLANCK 44 GHz Q-leakage map in the same area. Bottom: Angular polarization power spectra of the masked 44 GHz leakage map, compared with the Planck best-fit ΛCDM TT (scaled by 10−3) and EE spectra.
Current usage metrics show cumulative count of Article Views (full-text article views including HTML views, PDF and ePub downloads, according to the available data) and Abstracts Views on Vision4Press platform.
Data correspond to usage on the plateform after 2015. The current usage metrics is available 48-96 hours after online publication and is updated daily on week days.
Initial download of the metrics may take a while.