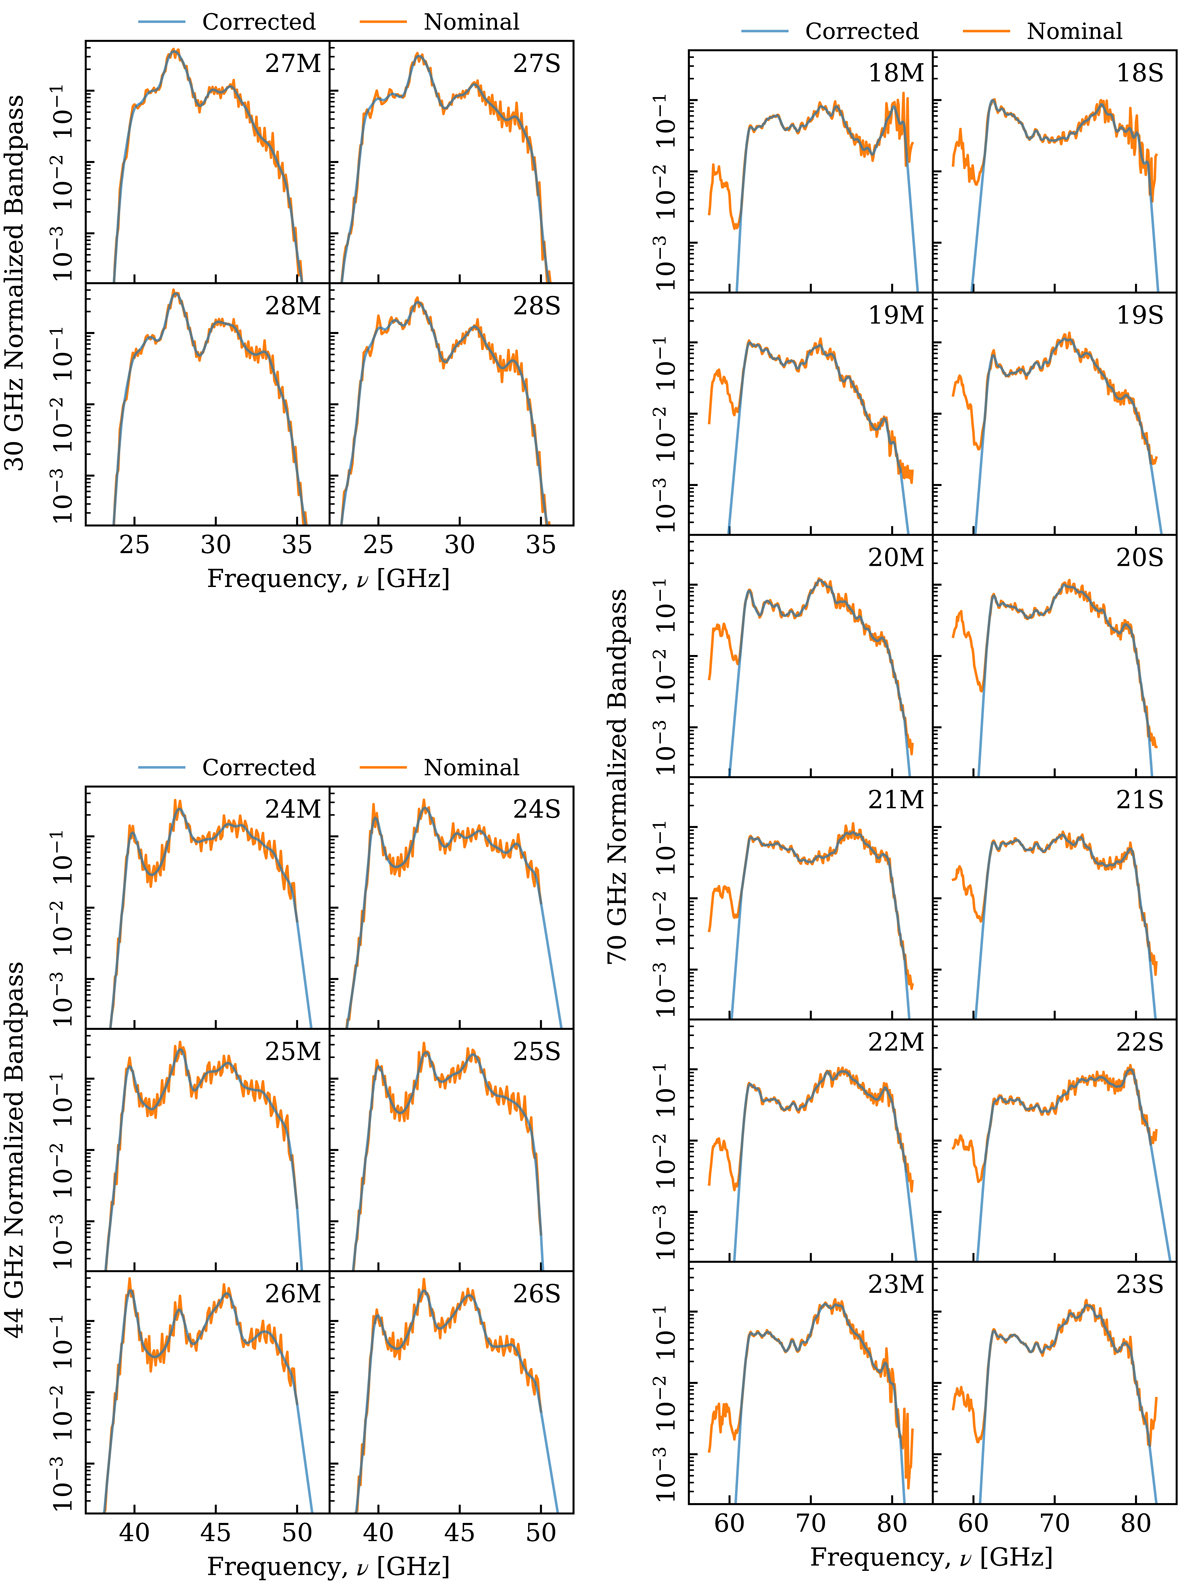
Fig. 3.
Download original image
Nominal and corrected bandpass profiles for LFI 30 GHz (top left), 44 GHz (bottom left), and 70 GHz (right) radiometers. Orange curves show raw bandpass profiles as provided by the Planck LFI DPC, and blue curves show the corrected profiles discussed in Sect. 2.
Current usage metrics show cumulative count of Article Views (full-text article views including HTML views, PDF and ePub downloads, according to the available data) and Abstracts Views on Vision4Press platform.
Data correspond to usage on the plateform after 2015. The current usage metrics is available 48-96 hours after online publication and is updated daily on week days.
Initial download of the metrics may take a while.