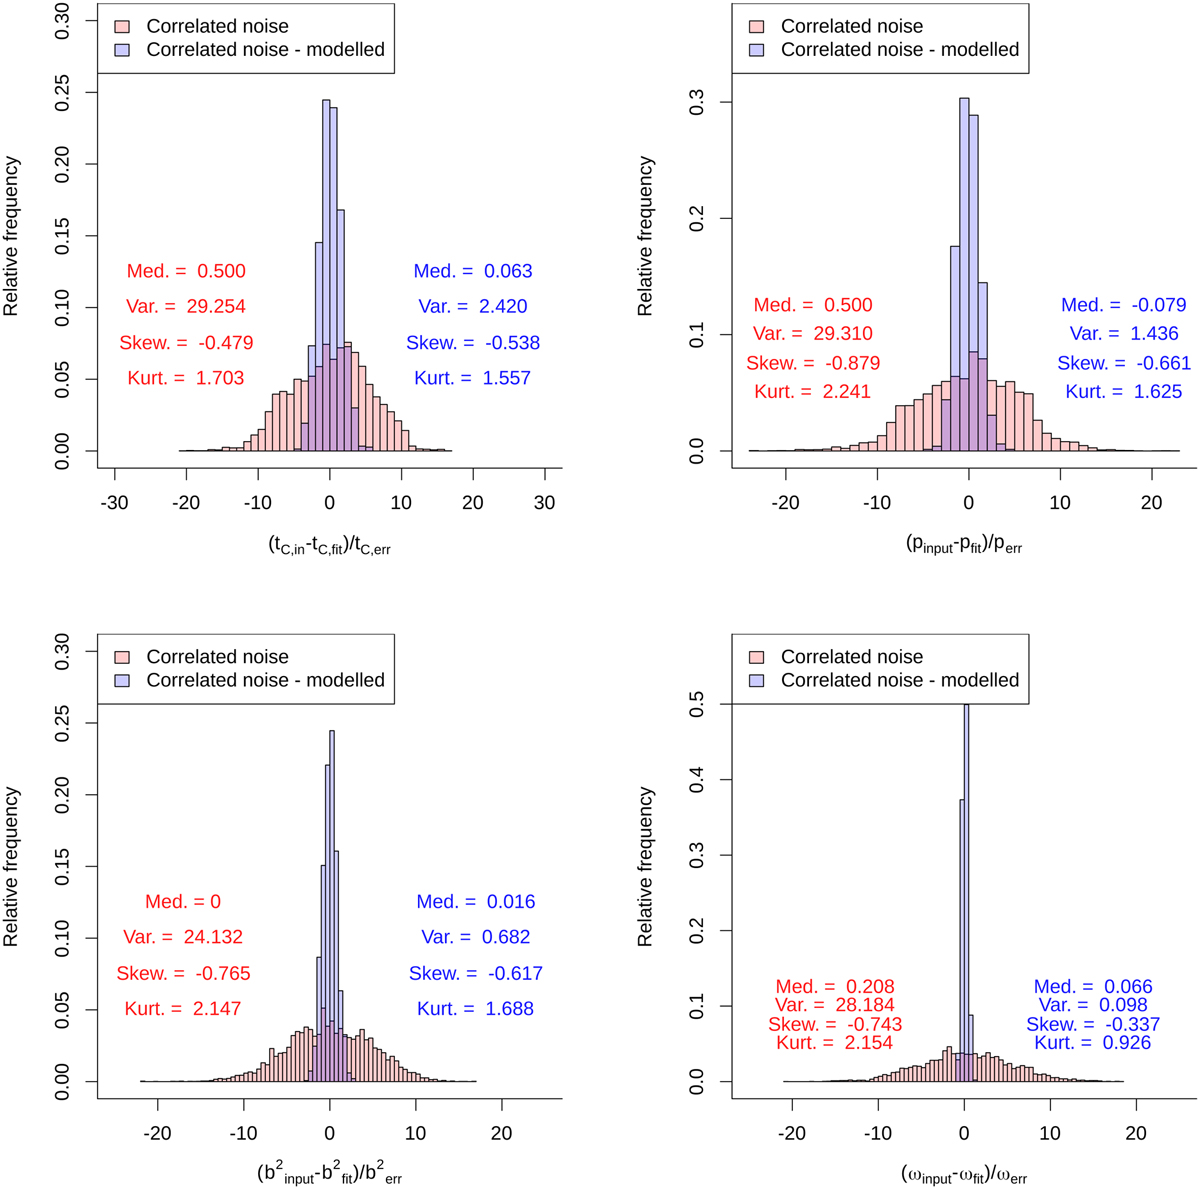
Fig. A.4
Download original image
Distribution of the differences between the input parameters and the fitted parameters for the same correlated noise model, without the noise fitting (red, i.e. same as on Fig. A.2) and with the red noise handled through wavelet transformation (blue), scaled with the uncertainties estimated from the fitting. The median, variance, skewness, and kurtosis of the distributions is also shown.
Current usage metrics show cumulative count of Article Views (full-text article views including HTML views, PDF and ePub downloads, according to the available data) and Abstracts Views on Vision4Press platform.
Data correspond to usage on the plateform after 2015. The current usage metrics is available 48-96 hours after online publication and is updated daily on week days.
Initial download of the metrics may take a while.