| Issue |
A&A
Volume 693, January 2025
|
|
|---|---|---|
| Article Number | C4 | |
| Number of page(s) | 2 | |
| Section | Planets, planetary systems, and small bodies | |
| DOI | https://doi.org/10.1051/0004-6361/202453095e | |
| Published online | 14 January 2025 | |
Power of wavelets in analyses of transit and phase curves in the presence of stellar variability and instrumental noise
II. Accuracy of the transit parameters (Corrigendum)
1
ELTE Eötvös Loránd University, Doctoral School of Physics,
Budapest,
1117
Budapest Pázmány Péter sétány 1/A,
Hungary
2
Konkoly Observatory, HUN-REN Research Centre for Astronomy and Earth Sciences,
Konkoly-Thege Miklós út 15–17,
1121
Budapest,
Hungary
3
CSFK, MTA Centre of Excellence,
1121
Budapest,
Konkoly Thege Miklós út 15–17,
Hungary
4
HUN-REN-ELTE Exoplanet Research Group,
9700 Szent Imre h. u. 112,
Szombathely,
Hungary
5
ELTE Eötvös Loránd University, Gothard Astrophysical Observatory,
9700
Szent Imre h. u. 112,
Szombathely,
Hungary
6
Deutsches Zentrum für Luft–und Raumfahrt, Institute of Planetary Research,
Rutherfordstrasse 2,
12489
Berlin,
Germany
★ Corresponding author; This email address is being protected from spambots. You need JavaScript enabled to view it.
Key words: methods: data analysis / techniques: photometric / planets and satellites: general / errata, addenda
An error was found in the data compilation pipeline used in the study of parameter stability using the wavelet-based noise filtering technique. As a consequence, the uncertainty of one of the fitting parameters (the impact parameter) was overestimated by a factor of ~3. Here we present the corrected version of the corresponding figures. We note that the conclusion from the original work still holds true.
In Kálmán et al. 2023, we presented a study on the stability of certain parameters that are used to described the transit of an exoplanet against time-correlated noise. We utilized two different software, FITSH (Pál 2012) and TLCM (Transit and Light Curve Modeller; Csizmadia 2020), the latter of which uses the wavelet-based noise filtering technique of Carter & Winn (2009). In TLCM, the transits are parametrized via the so-called conjunction parameter (Csizmadia 2020):
 (1)
(1)
where a is the semi-major axis, RS is the stellar radius, e and i denote the orbital eccentricity and inclination (measured from the line of sight), respectively, and ω is the argument of periastron. For circular orbits (e = 0) that were considered in Kálmán et al. (2023), this expression is simplified to the commonly used definition of the impact parameter
 (2)
(2)
Given that b′ is used in the light curve fitting, only the corresponding uncertainty (Δb′) is estimated directly from the posteriors, as described in Csizmadia (2020), while the uncertainty of b (Δb) is calculated by error propagation from a/RS (an independent fitting parameter describing the transits) and i (derived from Eq. (2)). The uncertainty propagation is done via a Monte Carlo simulation. As a consequence, Δb is generally greater than Δb′. In Kálmán et al. (2023), we mistakenly reported findings based on b ± Δb instead of b′ ± Δb′. Although the expectation values are the same (b′ = b), this influenced the calculation of variance, skewness, and kurtosis of the resultant distribution of the parameters b2 and  due to the propagation of uncertainty of the fitting based on TLCM in the original paper. In this corrigendum, we rectify that oversight, using the same datasets that were already described in detail in Kálmán et al. (2023).
Using  to compute the distribution shown in the bottom row of Fig. A.4 of Kálmán et al. (2023) instead of
  , we calculated the histograms shown in Fig. 1. We note that only these two distributions are affected by the oversight expressed. We find that the variance of the (squared) impact parameters (left panel of Fig. 1) increases from 0.682 to 4.881, and the skewness and kurtosis change from −0.617 and 1.688 to −0.654 and 1.937, respectively. In essence, this implies that the uncertainty of the conjunction parameter is underestimated by TLCM in this particular case by a factor of ~2 (since for a Gaussian distribution we would expect a variance of 1, corresponding to a standard deviation of 1). The other two metrics remain relatively unchanged. We also find that the variance, skewness, and kurtosis of the distribution of the ω parameter in the wavelet-based noise handling case change from 0.098, −0.337, and 0.927 to 0.437, −0.564, and 1.474, respectively. Similarly to b2, the most significant change occurs in the second statistical momentum, implying that the distribution of the relative errors of the ω parameter are overestimated by a factor of 1.5 (after accounting for the uncertainty propagation).
The changes presented here still allow us to argue for the clear benefits of the wavelet-based handling time-correlated (“red”) noise when compared to a method without noise handling, retaining the principal findings of Kálmán et al. (2023).
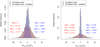 |
Fig. 1 Distribution of the differences between the input parameters and the fitted parameters without noise filtering (red) and with the wavelet-based noise filtering (blue) for b2 and ω, the fitting parameters of the software package FITSH. These are in principle the same as the bottom row of Fig. A.4 of Kálmán et al. (2023), with the uncertainty of the fitting parameter (b′) used for the calculation of the blue histograms. The medians, variances, skewnesses, and kurtoses of the distributions are also shown. |
Acknowledgements
This work was supported by a PRODEX Experiment Agreement No. 4000137122 between the ELTE Eötvös Loránd University and the European Space Agency (ESA-D/SCI-LE-2021-0025). Support of the Lendület LP2018-7/2021 grant of the Hungarian Academy of Science is acknowledged. SzCs thanks DFG Research Unit 2440: ‘Matter Under Planetary Interior Conditions: High Pressure, Planetary, and Plasma Physics’ for support. He also acknowledges support by DFG grants RA 714/14-1 within the DFG Schwerpunkt SPP 1992: ‘Exploring the Diversity of Extrasolar Planets‘. Project no. C1746651 has been implemented with the support provided by the Ministry of Culture and Innovation of Hungary from the National Research, Development and Innovation Fund, financed under the NVKDP-2021 funding scheme. The authors gratefully acknowledge the European Space Agency and the PLATO Mission Consortium, whose outstanding efforts have made these results possible. This project has received funding from the HUN-REN Hungarian Research Network.
References
- Carter, J. A., & Winn, J. N. 2009, ApJ, 704, 51 [Google Scholar]
- Csizmadia, S. 2020, MNRAS, 496, 4442 [Google Scholar]
- Kálmán, S., Szabó, G. M., & Csizmadia, S. 2023, A&A, 675, A107 [NASA ADS] [CrossRef] [EDP Sciences] [Google Scholar]
- Pál, A. 2012, MNRAS, 421, 1825 [Google Scholar]
© The Authors 2025
 Open Access article, published by EDP Sciences, under the terms of the Creative Commons Attribution License (https://creativecommons.org/licenses/by/4.0), which permits unrestricted use, distribution, and reproduction in any medium, provided the original work is properly cited.
This article is published in open access under the Subscribe to Open model. This email address is being protected from spambots. You need JavaScript enabled to view it. to support open access publication.
All Figures
|
Fig. 1 Distribution of the differences between the input parameters and the fitted parameters without noise filtering (red) and with the wavelet-based noise filtering (blue) for b2 and ω, the fitting parameters of the software package FITSH. These are in principle the same as the bottom row of Fig. A.4 of Kálmán et al. (2023), with the uncertainty of the fitting parameter (b′) used for the calculation of the blue histograms. The medians, variances, skewnesses, and kurtoses of the distributions are also shown. |
| In the text | |
Current usage metrics show cumulative count of Article Views (full-text article views including HTML views, PDF and ePub downloads, according to the available data) and Abstracts Views on Vision4Press platform.
Data correspond to usage on the plateform after 2015. The current usage metrics is available 48-96 hours after online publication and is updated daily on week days.
Initial download of the metrics may take a while.