Fig. 3
Download original image
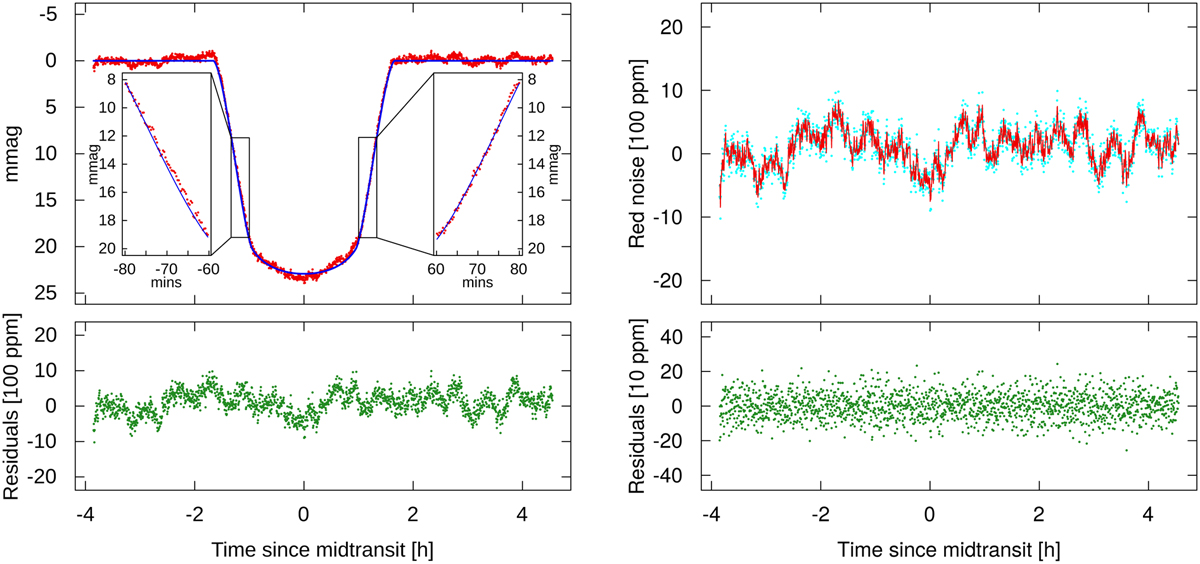
Same simulated light curve shown in Fig. 2 (upper-left panel, in red), along with the fitted transit light curve via TLCM (upper-left panel, in blue) and the residuals (lower-left panel). Note: the TTV-like phenomena is not present in this case, as is visible on the two inset plots. The upper-right panel shows the residuals (or, ideally, the identified noise) with cyan, while the red curve denotes the fitted correlated noise. The residuals of the noise fitting are shown on the bottom-right panel.
Current usage metrics show cumulative count of Article Views (full-text article views including HTML views, PDF and ePub downloads, according to the available data) and Abstracts Views on Vision4Press platform.
Data correspond to usage on the plateform after 2015. The current usage metrics is available 48-96 hours after online publication and is updated daily on week days.
Initial download of the metrics may take a while.