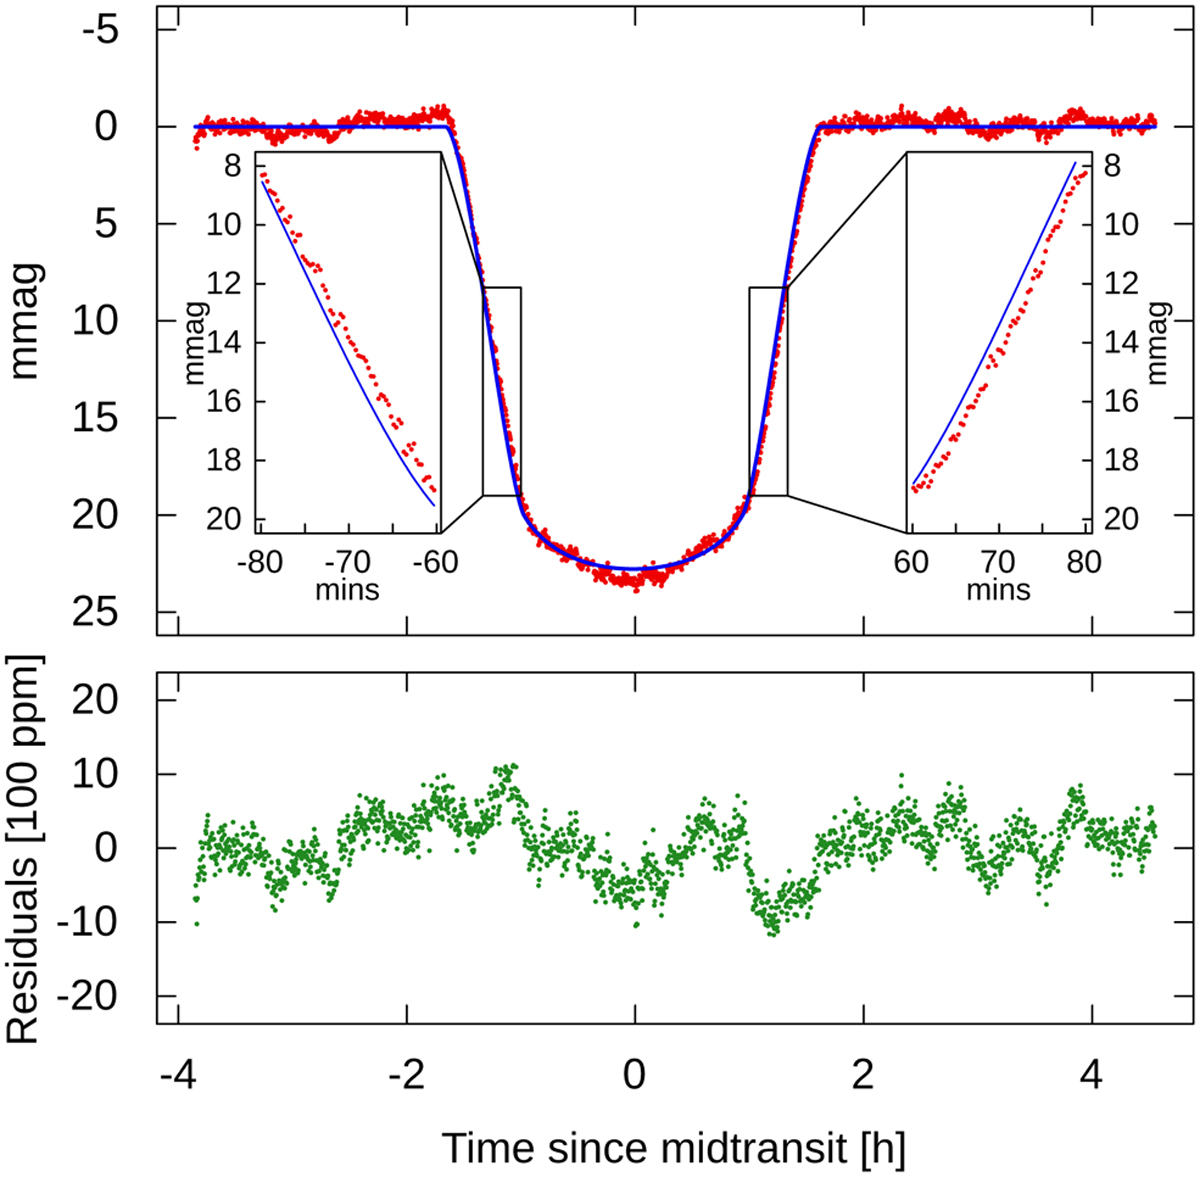
Fig. 2
Download original image
Typical example of a simulated noise transit light curve (upper panel, red), its lfit solution (upper panel, blue) and the residuals (lower panel). Note: both during the ingress an egress phases, the blue curve is shifted to the left of the simulated points, meaning that purely the presence of correlated noise can induce TTV-like phenomena. The difference between the simulated and best-fit curves during these phases is emphasised using the two inset plots.
Current usage metrics show cumulative count of Article Views (full-text article views including HTML views, PDF and ePub downloads, according to the available data) and Abstracts Views on Vision4Press platform.
Data correspond to usage on the plateform after 2015. The current usage metrics is available 48-96 hours after online publication and is updated daily on week days.
Initial download of the metrics may take a while.