Fig. 3
Download original image
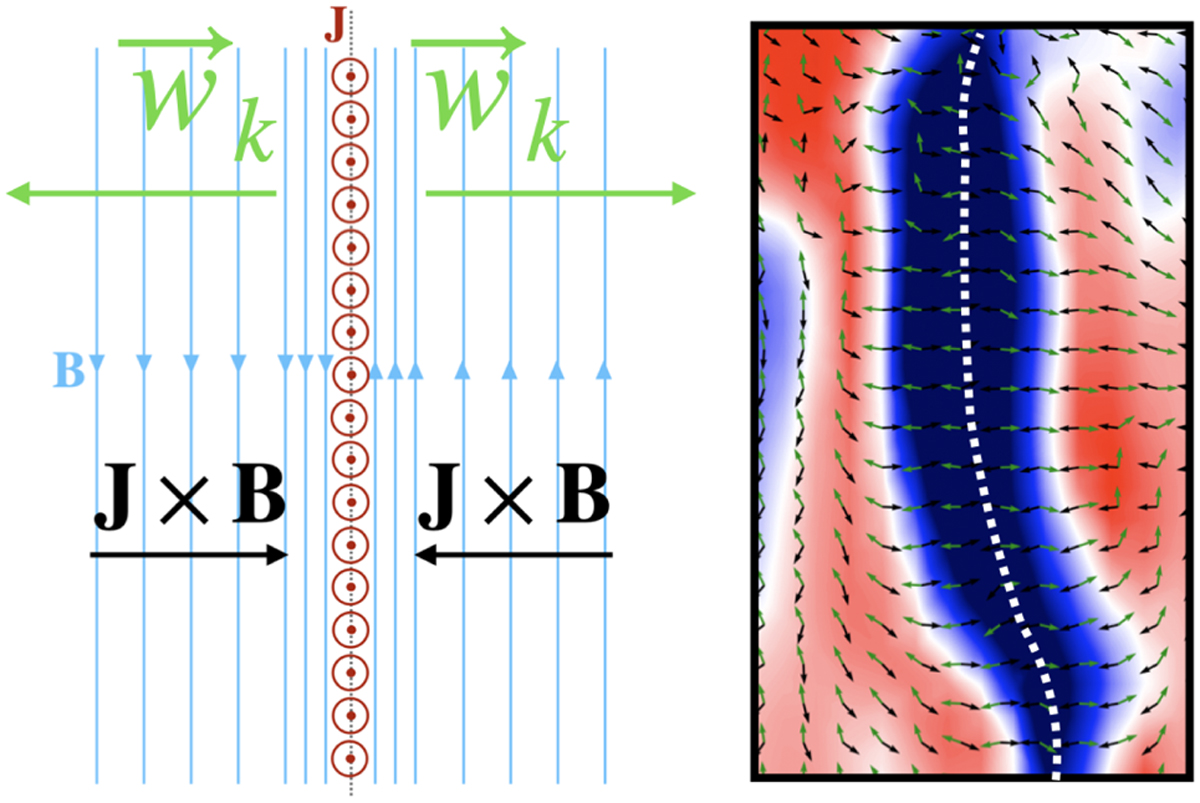
Cartoon illustrating the decoupling of the gas and dust near a current sheet. Left: schematic local view of a current sheet and the dust drift velocity in its vicinity; B is the magnetic field, J is the electric current and wk is the dust drift velocity. Right: dust ratio variation near a current sheet (zoom in and 90 degree rotation of the left snapshot of Fig. 5; the color scale is the same, with red high and blue low). The dotted line shows the approximate (hand drown) position of the current sheet, the white arrow represent the drift velocity (green) and J × B (black) direction projected in the plane of the slice.
Current usage metrics show cumulative count of Article Views (full-text article views including HTML views, PDF and ePub downloads, according to the available data) and Abstracts Views on Vision4Press platform.
Data correspond to usage on the plateform after 2015. The current usage metrics is available 48-96 hours after online publication and is updated daily on week days.
Initial download of the metrics may take a while.