Fig. 5.
Download original image
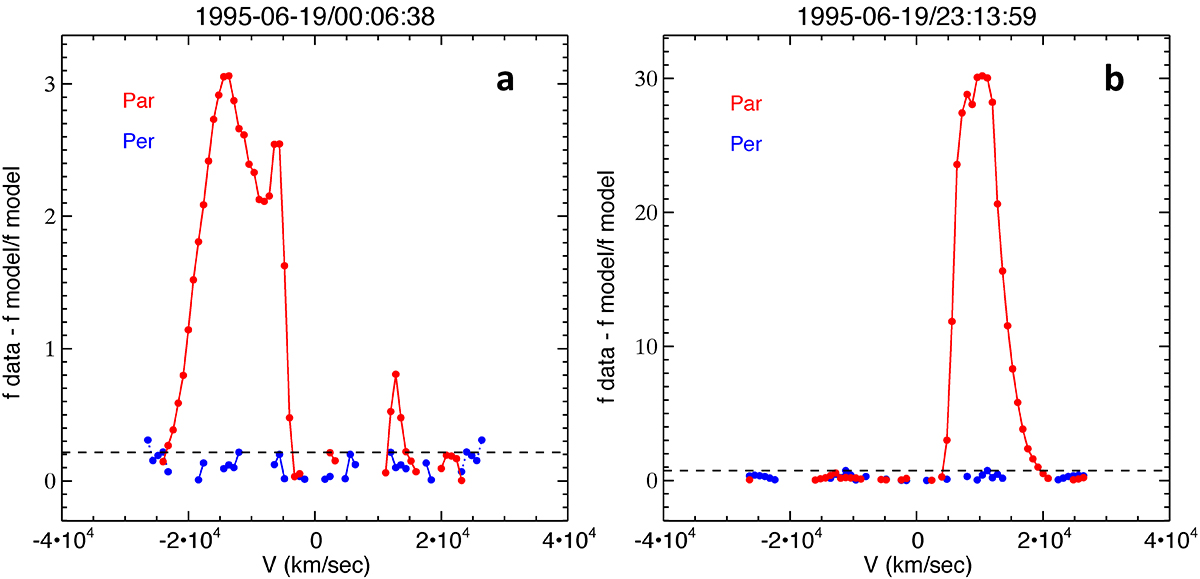
Illustration of the algorithm used to extract the strahl from the eVDFs of Fig. 4; the left panel (a) shows the slow wind eVDF and the right panel (b) shows the fast wind eVDF. Cuts through the Δ distribution (see text) in the parallel and perpendicular direction are indicated in red and blue, respectively. The obvious peak in the parallel cut in red shows the range and structure of the strahl. In the fast wind, the strahl is much more prominent than in the slow wind. However, the strahl is wider in the slow wind than in the fast wind. The dashed horizontal line represents the threshold for the automated extraction of the strahl.
Current usage metrics show cumulative count of Article Views (full-text article views including HTML views, PDF and ePub downloads, according to the available data) and Abstracts Views on Vision4Press platform.
Data correspond to usage on the plateform after 2015. The current usage metrics is available 48-96 hours after online publication and is updated daily on week days.
Initial download of the metrics may take a while.