Fig. 4.
Download original image
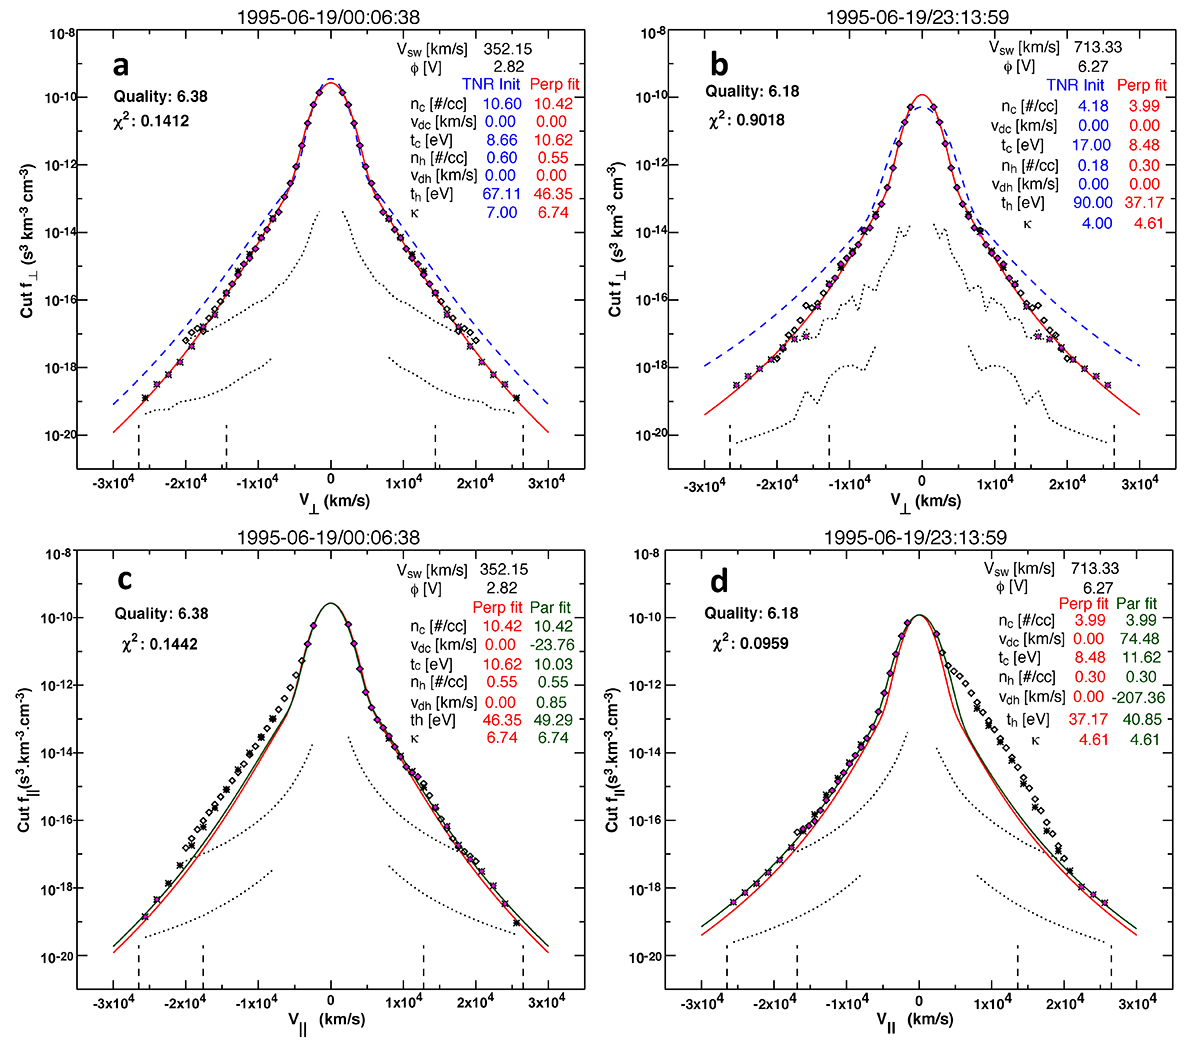
Two typical eVDFs measured by EESA-L and EESA-H at 1 au in the slow solar wind – panels (a) and (c) –, and in the fast solar wind – panels (b) and (d). The top panels (a) and (b) show cuts through the eVDF in one of the two directions perpendicular to the local magnetic field B: the diamonds are data points from EESA-L and the asterisks from EESA-H. The dotted lines represent the one-count levels for EESA-L and EESA-H. The blue dashed line represents the sum of Maxwellian and κ-distributions calculated using the QTN fit parameters (indicated in blue), which are used to initialize the eVDF fit. The red line represents the fit to the measured perpendicular eVDF cut; the resulting fit parameters are indicated in red. The bottom panels (c) and (d) show cuts through the eVDF in the direction parallel to B. The perpendicular fit is reported in red, and the perpendicular fit parameters are used to initialize the parallel eVDF fit, the results of which are given in green. In each plot, the points that are selected for inclusion in the eVDF fit are filled with pink color.
Current usage metrics show cumulative count of Article Views (full-text article views including HTML views, PDF and ePub downloads, according to the available data) and Abstracts Views on Vision4Press platform.
Data correspond to usage on the plateform after 2015. The current usage metrics is available 48-96 hours after online publication and is updated daily on week days.
Initial download of the metrics may take a while.