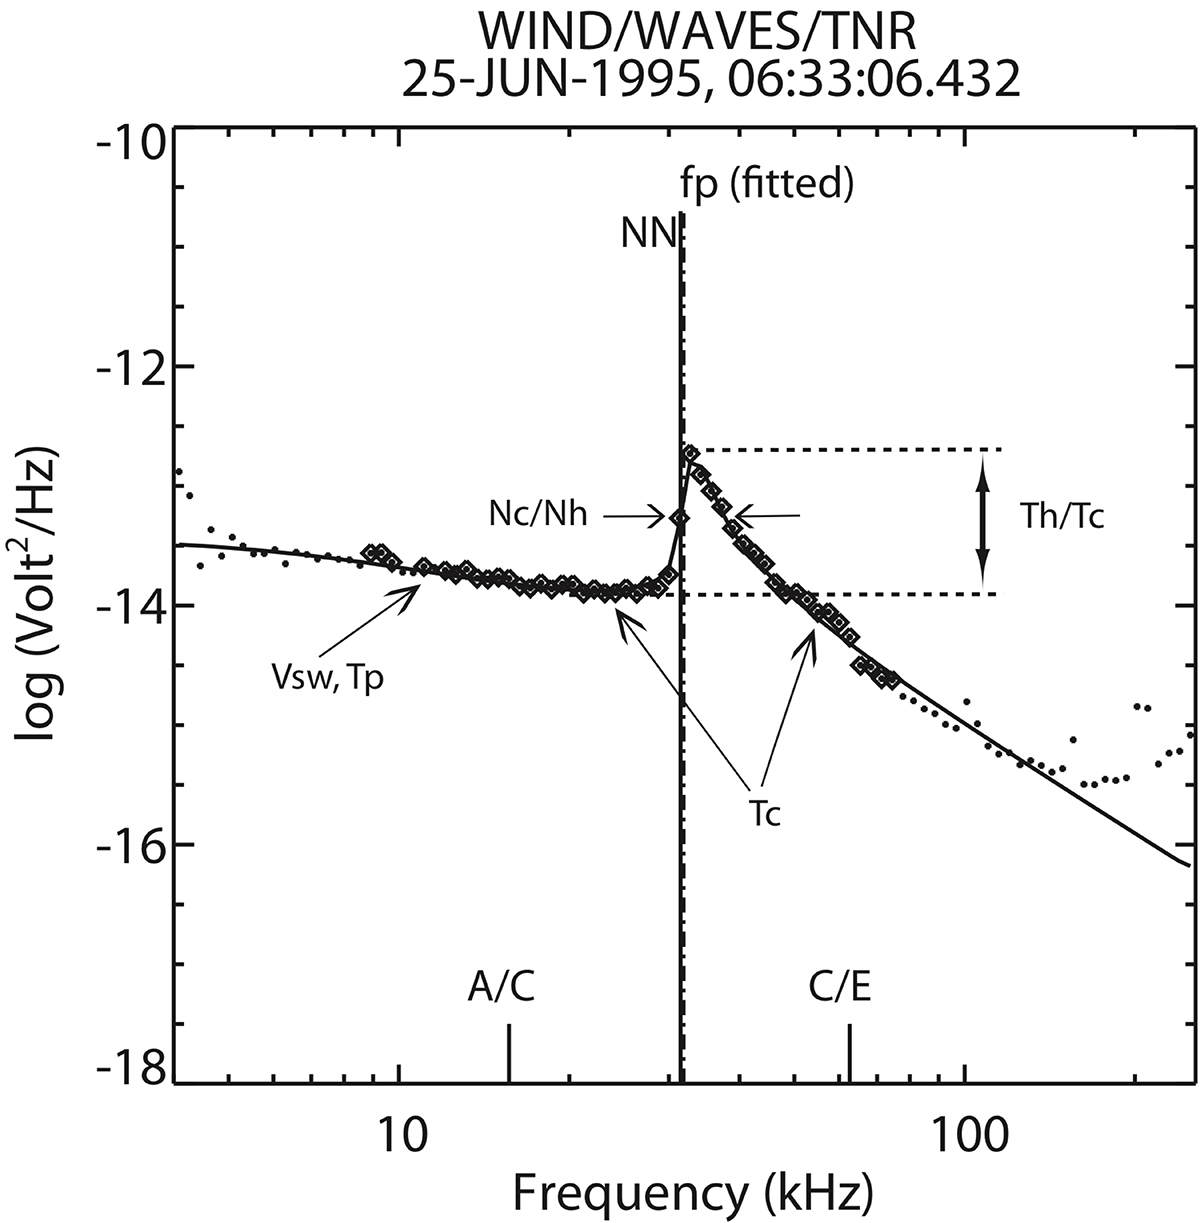
Fig. 2.
Download original image
Example of a typical voltage power spectrum around the electron plasma frequency measured by the Wind/WAVES/TNR instrument in the solar wind on June 25, 1995. The solid line is the predicted spectrum fitted to the selected data (in diamonds) among data not retained (dots) for the QTN fitting (see text). The annotations indicate the electron parameters obtained by fitting the theoretical spectrum from the ion and the electron QTN, using a sum of two isotropic Mxwellians – a core “c” and a halo “h” – to the observed spectrum. The vertical line indicate the locations of the local electron plasma frequency obtained by both a Neural Network (“NN”, solid line) and by QTN fit (“fitted”, dashed line).
Current usage metrics show cumulative count of Article Views (full-text article views including HTML views, PDF and ePub downloads, according to the available data) and Abstracts Views on Vision4Press platform.
Data correspond to usage on the plateform after 2015. The current usage metrics is available 48-96 hours after online publication and is updated daily on week days.
Initial download of the metrics may take a while.