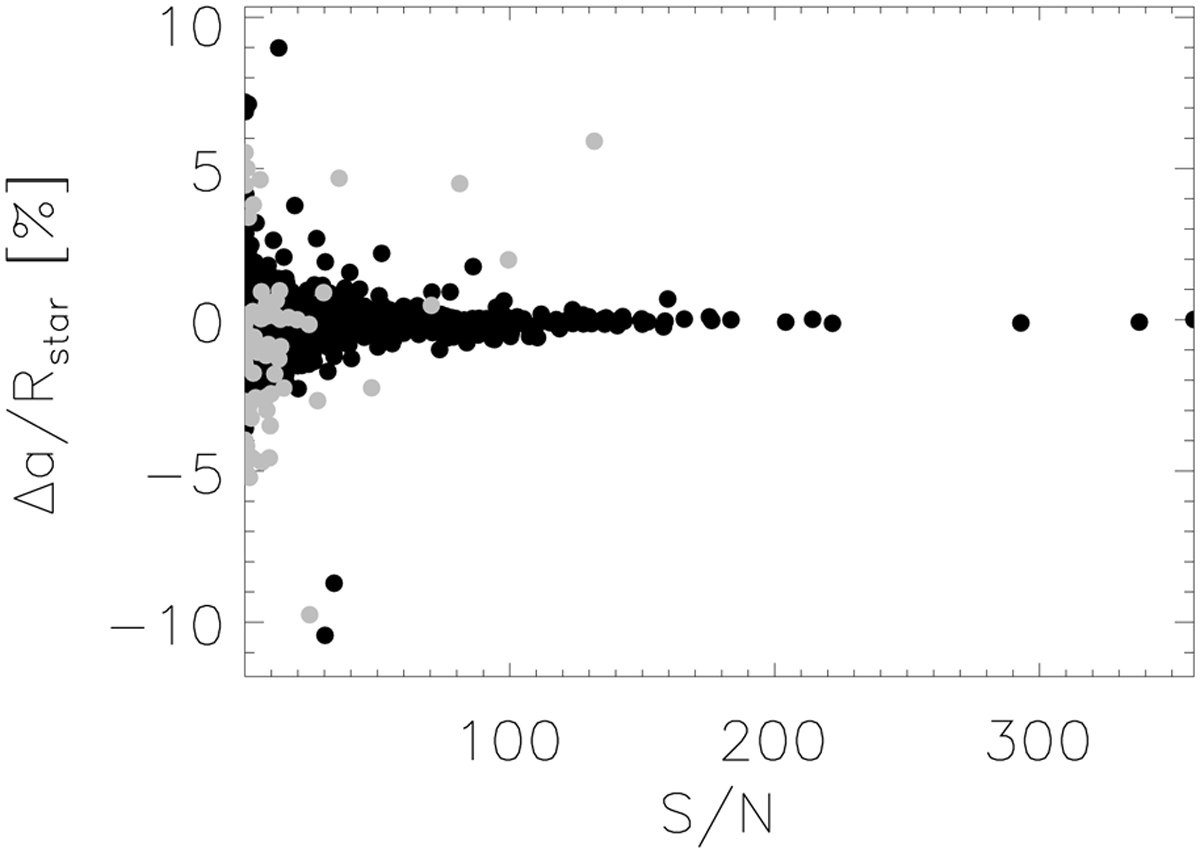
Fig. 5
Download original image
Result of the light curve test for the a/Rstar parameter. The ordinate is the S/N-ratio defined by Eq. (34). The y-axis is the difference between the simulated and the retrieved scaled semi-major axis in percentage. Black dots denote the solutions where the stellar radius value was obtained to be with 3% accuracy relative to the injected stellar radius, while gray points represent the cases where we had obtained them with 3–6% accuracy.
Current usage metrics show cumulative count of Article Views (full-text article views including HTML views, PDF and ePub downloads, according to the available data) and Abstracts Views on Vision4Press platform.
Data correspond to usage on the plateform after 2015. The current usage metrics is available 48-96 hours after online publication and is updated daily on week days.
Initial download of the metrics may take a while.