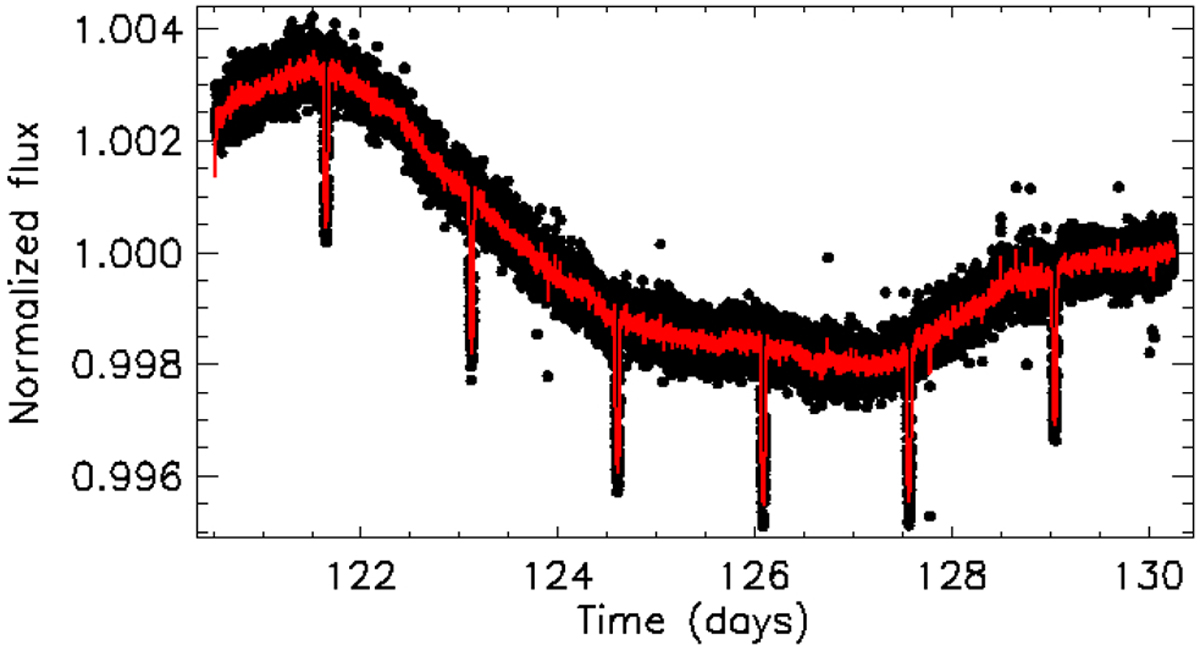
Fig. A.1
Download original image
Kepler target 004851239, 1 min cadence data. Here (and in other Figures of the appendix) black dots are the SAP fluxes while the red line is the simultaneous fit of the transit+phase curve model and the noise model. Note: the transits and phase curve variations here and in other test cases in this paper were not in the original Kepler data: they were injected by us for test purposes.
Current usage metrics show cumulative count of Article Views (full-text article views including HTML views, PDF and ePub downloads, according to the available data) and Abstracts Views on Vision4Press platform.
Data correspond to usage on the plateform after 2015. The current usage metrics is available 48-96 hours after online publication and is updated daily on week days.
Initial download of the metrics may take a while.