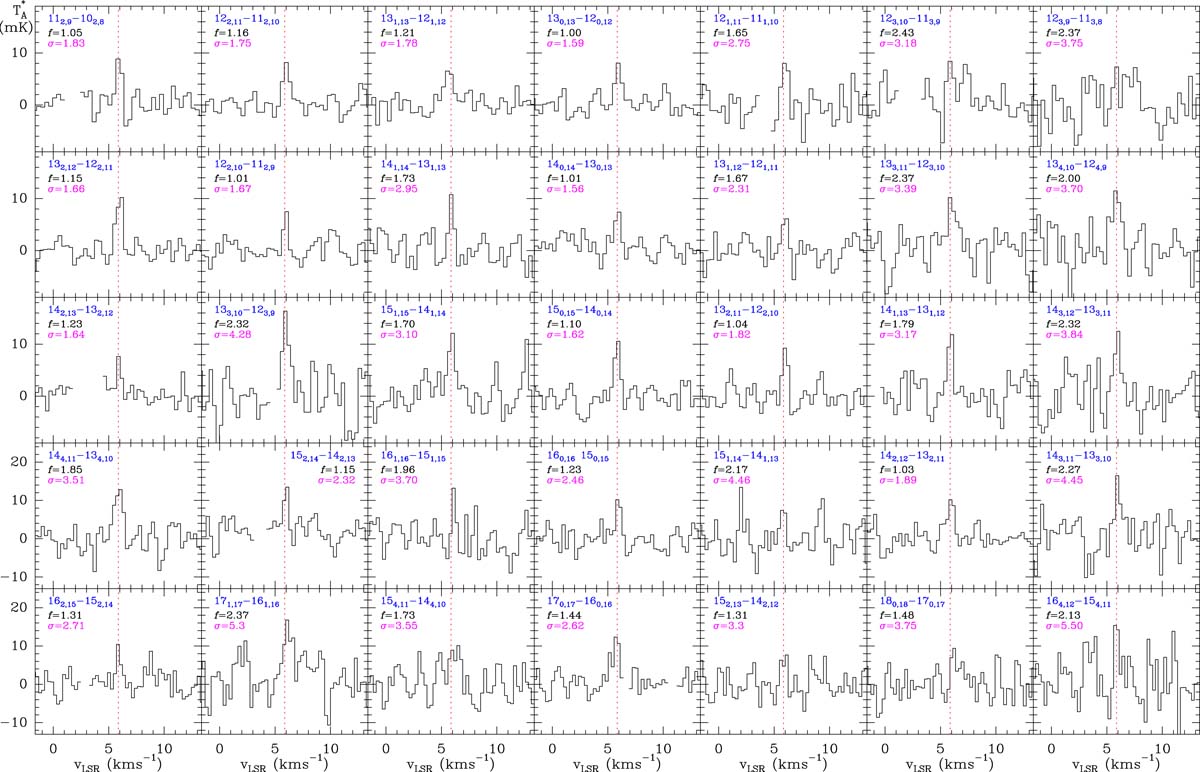
Fig. B.1.
Download original image
Selected transitions of C6H5CN among the 49 lines (see Table B.1) used to produce the spectrally stacked map of benzonitrile at each position of the map. The spectra shown here correspond to the central position. The transition quantum numbers are indicated in blue in the top left corner of each panel. Each line arises from the individual maps with Sgrid = 20″ and Trad = 20″. Each line spectrum was multiplied by the factor f (shown in black in each panel) to scale its intensity to that of the strongest one (the 130, 13-120, 12 transition). The noise of each spectra, after multiplication by f, is shown in violet (σ; in mK). It is used to weight the data during stacking of all the lines at each position of the map (see text). The vertical dashed red lines in each panel indicate the local standard of rest velocity of 5.86 km s−1. The spectra of the resulting stacked data at different positions of the map are shown in Fig. 1.
Current usage metrics show cumulative count of Article Views (full-text article views including HTML views, PDF and ePub downloads, according to the available data) and Abstracts Views on Vision4Press platform.
Data correspond to usage on the plateform after 2015. The current usage metrics is available 48-96 hours after online publication and is updated daily on week days.
Initial download of the metrics may take a while.