Open Access
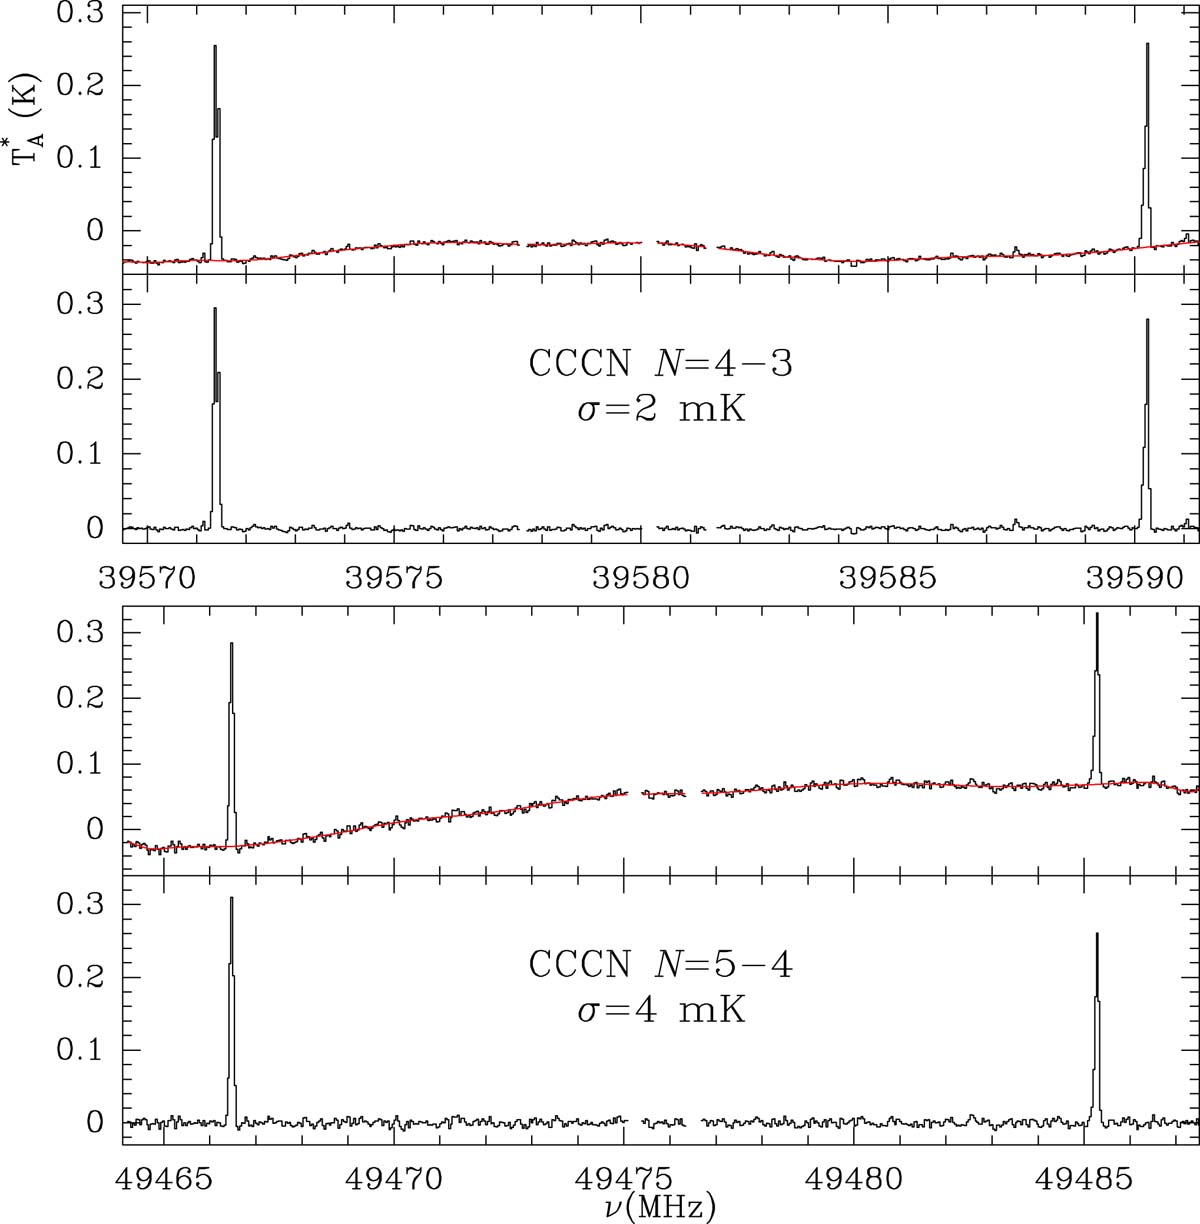
Fig. A.1.
Download original image
Observed lines of CCCN before and after baseline subtraction. For each transition of CCCN the upper panel shows the raw data and the fitted baseline (red line) at the centre position of the map with Sgrid = 20″ and Trad = 20″. The panel below each transition shows the data after a polynomial baseline removal.
Current usage metrics show cumulative count of Article Views (full-text article views including HTML views, PDF and ePub downloads, according to the available data) and Abstracts Views on Vision4Press platform.
Data correspond to usage on the plateform after 2015. The current usage metrics is available 48-96 hours after online publication and is updated daily on week days.
Initial download of the metrics may take a while.