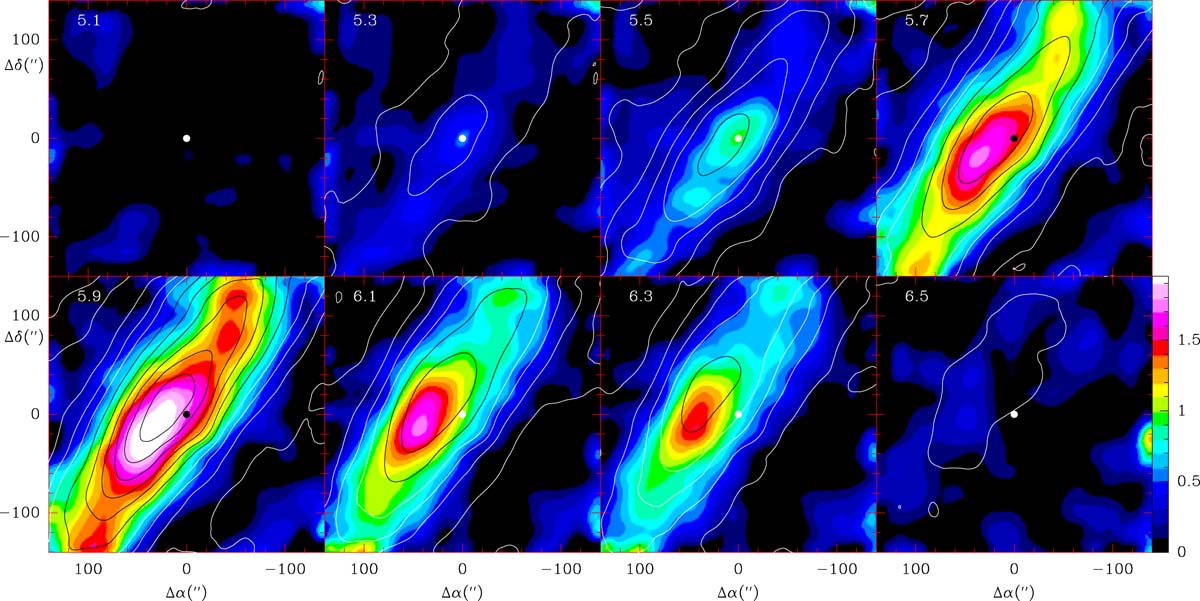
Fig. 3.
Download original image
Spatial distribution of the integrated intensity of the stacked lines of C6H5CN at different velocities. The selected velocity range is ±0.1 km s−1 around the velocity indicated in the upper right corner of each panel (in km s−1). The sampling of the data is 20″ and the integrating area in each position corresponds to a circle of 20″ radius. The white and black contours represent the integrated intensity of the J = 28-27 transition of HC7N at the same velocity (±0.1 km s−1). The first white contour corresponds to 2 mK km s−1 and the step is 4 mK km s−1. The first black contour corresponds to 20 mK km s−1 and the step is 6 mK km s−1. The white or black dot indicates the centre of the map.
Current usage metrics show cumulative count of Article Views (full-text article views including HTML views, PDF and ePub downloads, according to the available data) and Abstracts Views on Vision4Press platform.
Data correspond to usage on the plateform after 2015. The current usage metrics is available 48-96 hours after online publication and is updated daily on week days.
Initial download of the metrics may take a while.