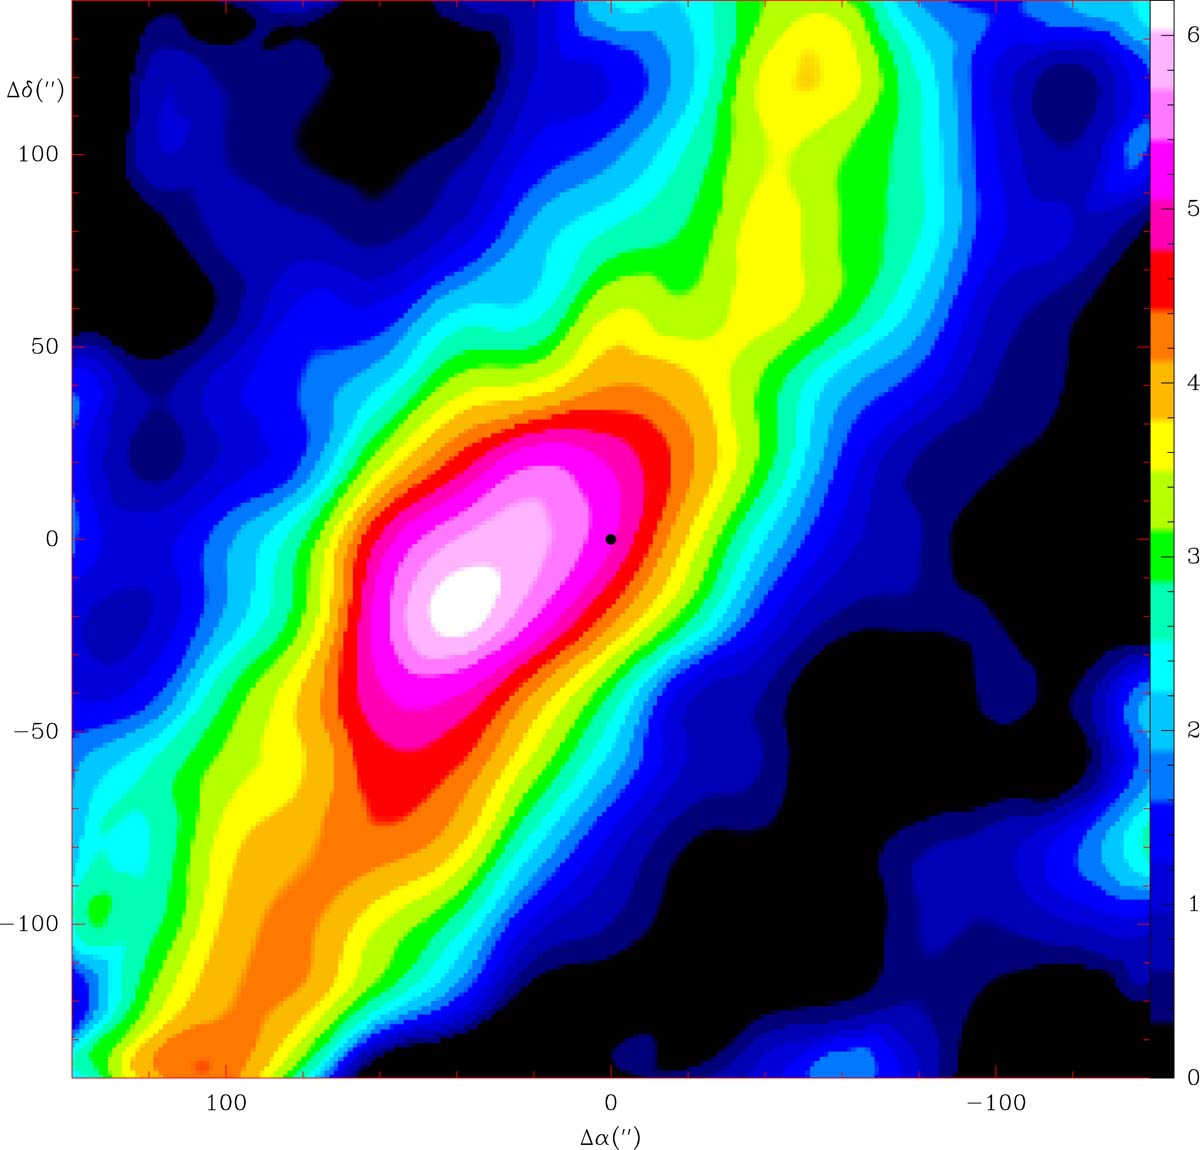
Fig. 2.
Download original image
Colour plot of spatial distribution of the integrated intensity between 5.3 and 6.5 km s−1 of the stacked lines of C6H5CN. The colour scale is in mK km s−1. The sampling of the data is 20″ and the integrating area in each position corresponds to a circle of 20″ of radius. The black dot indicates the centre of the map, which corresponds to the position observed with the QUIJOTE line survey.
Current usage metrics show cumulative count of Article Views (full-text article views including HTML views, PDF and ePub downloads, according to the available data) and Abstracts Views on Vision4Press platform.
Data correspond to usage on the plateform after 2015. The current usage metrics is available 48-96 hours after online publication and is updated daily on week days.
Initial download of the metrics may take a while.