Open Access
Fig. B.1.
Download original image
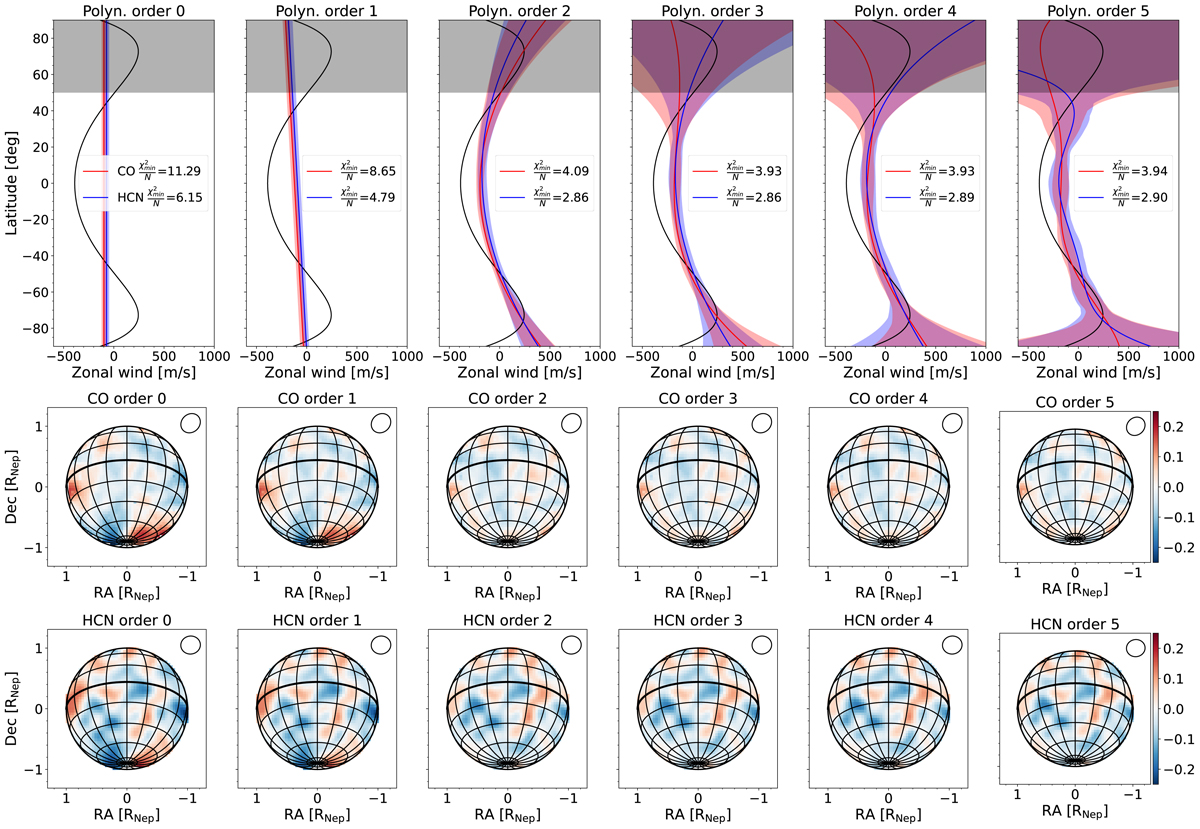
As in Fig. 3, top row shows the retrieved wind profiles for CO and HCN, but using different polynomial orders for the wind parameterization. The value of ![]() is shown in the legend. We also show the residual maps of CO (middle row) and HCN (bottom row) after subtracting the best-fitting wind profile to the measurements.
is shown in the legend. We also show the residual maps of CO (middle row) and HCN (bottom row) after subtracting the best-fitting wind profile to the measurements.
Current usage metrics show cumulative count of Article Views (full-text article views including HTML views, PDF and ePub downloads, according to the available data) and Abstracts Views on Vision4Press platform.
Data correspond to usage on the plateform after 2015. The current usage metrics is available 48-96 hours after online publication and is updated daily on week days.
Initial download of the metrics may take a while.