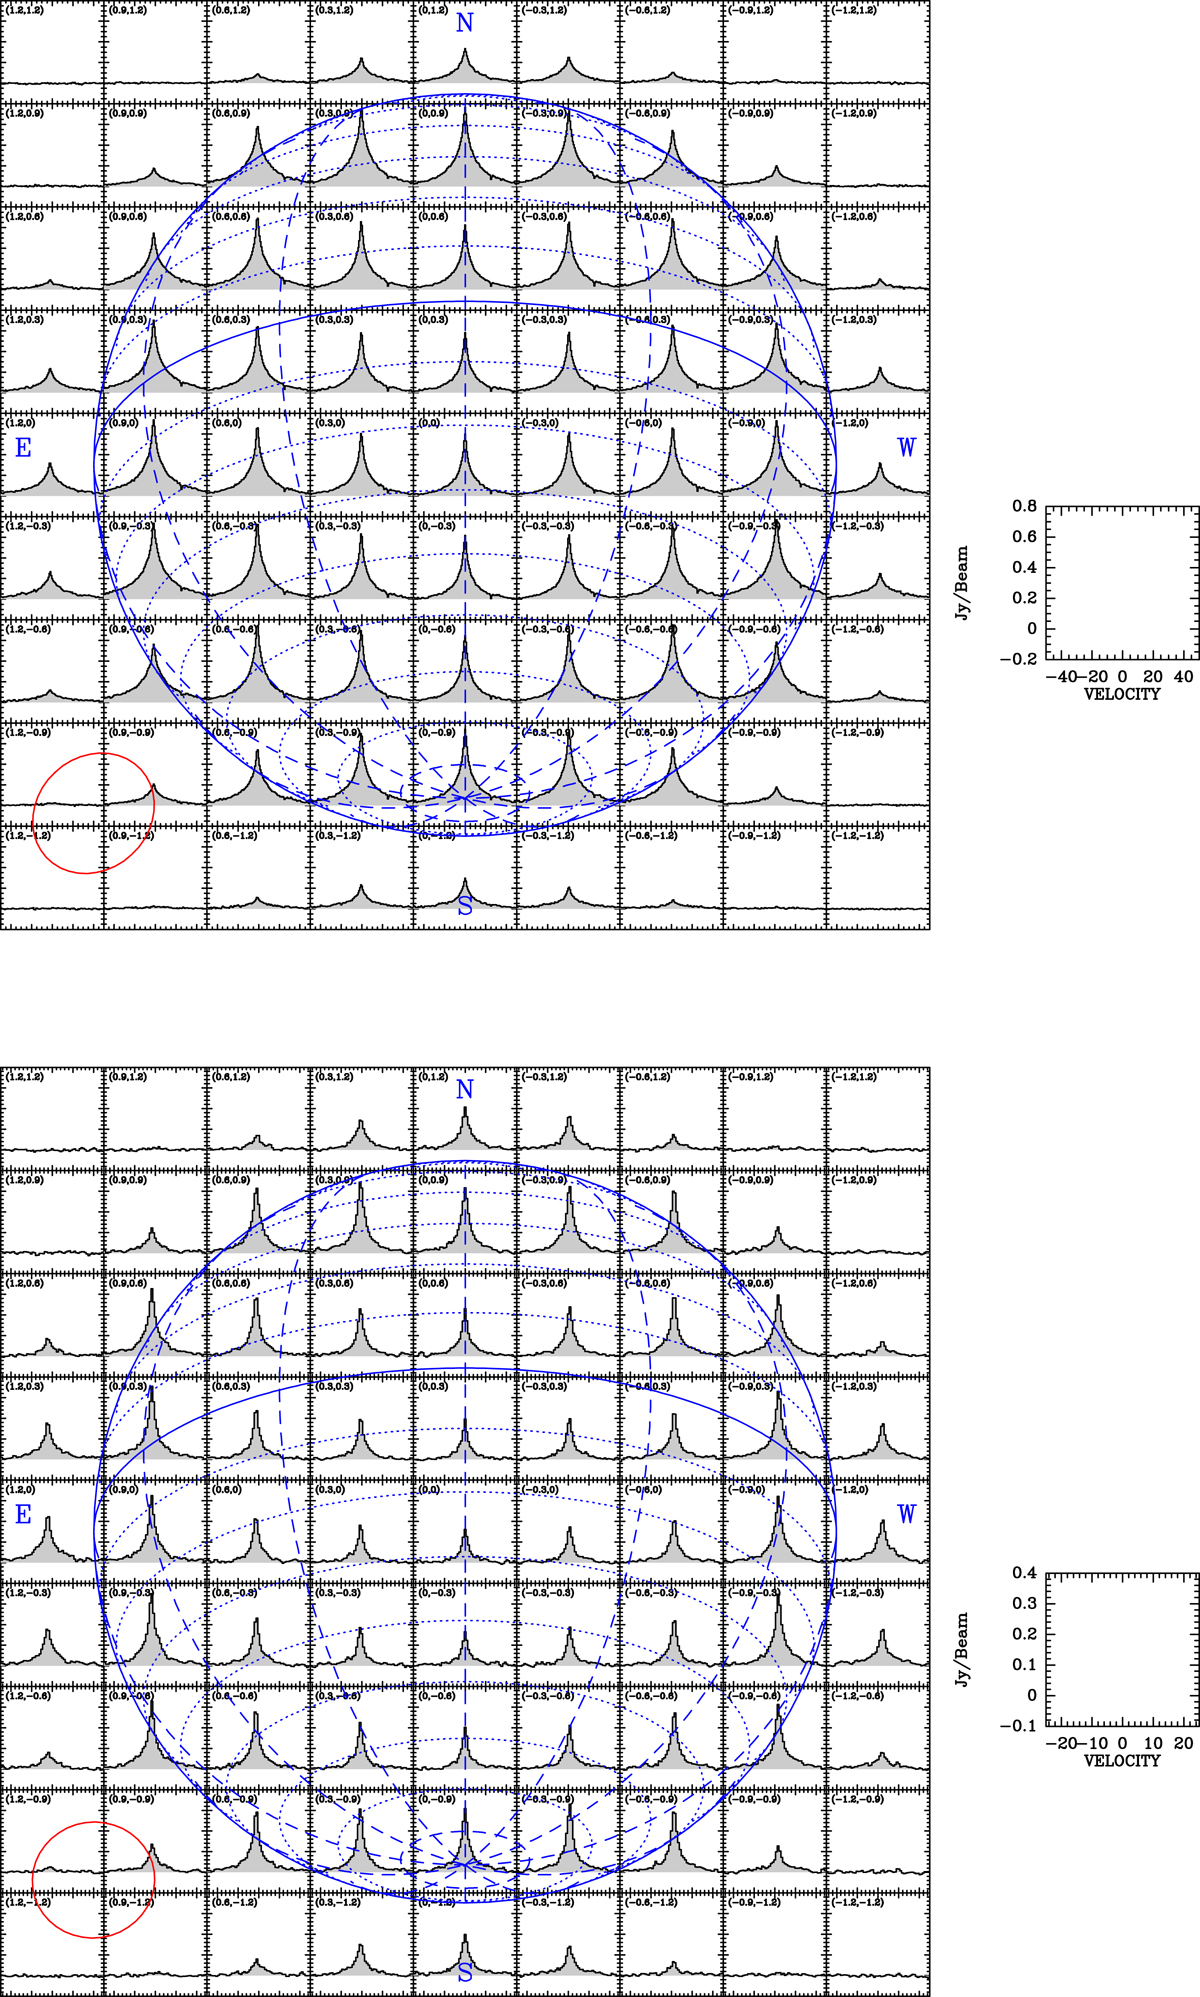
Fig. A.1.
Download original image
Measured spectral maps. Top: Spectral map of the CO(3–2) transition at 345.796 GHz on Neptune observed on April 30, 2016 with ALMA (top row). The spectral resolution is 1 MHz. The planet’s angular diameter is 2.24" and is shown by a blue circle. The synthesized beam is indicated with a red ellipse. The right box represent the scales of the spectra expressed in flux (Jy/beam) against velocity (km s−1). Bottom: Spectral map of the HCN(4–3) transition at 354.505 GHz, measured simultaneously with that of CO.
Current usage metrics show cumulative count of Article Views (full-text article views including HTML views, PDF and ePub downloads, according to the available data) and Abstracts Views on Vision4Press platform.
Data correspond to usage on the plateform after 2015. The current usage metrics is available 48-96 hours after online publication and is updated daily on week days.
Initial download of the metrics may take a while.