Fig. 3.

Download original image
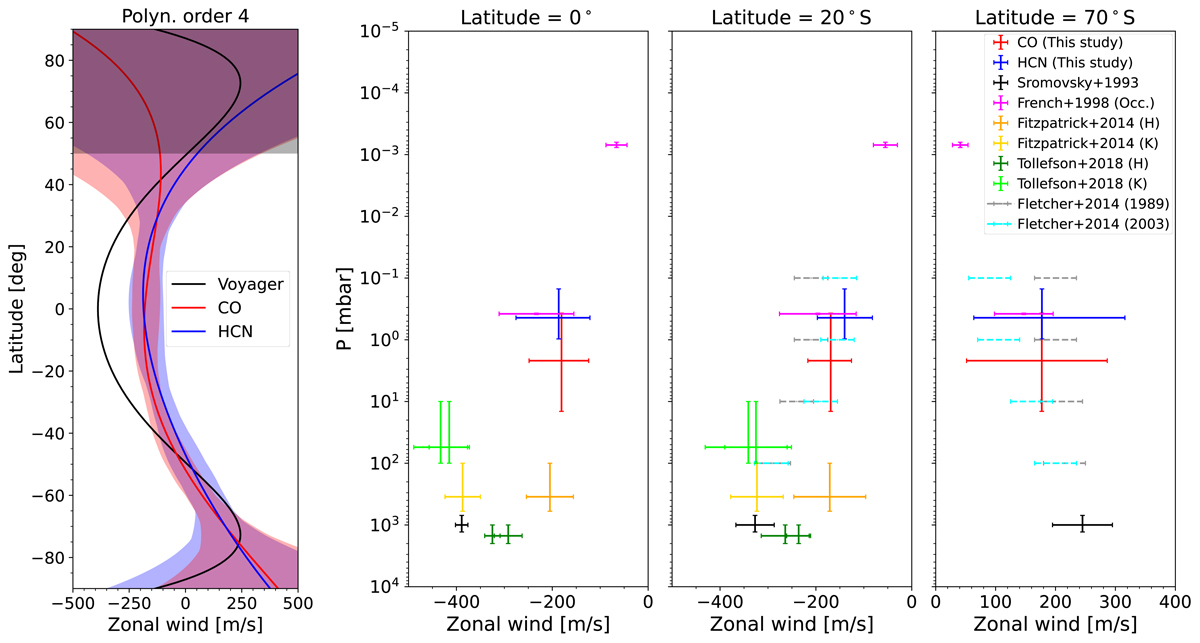
Retrieval results. Left: retrieved best-fitting wind profiles for CO (red line) and HCN (blue line) measurements, using a fourth-order polynomial. Red and blue shadowed regions contain the ensemble of good fits according to the χ2 criterion from Eq. (3). The semi-transparent grey rectangle indicates the unobservable northern latitudes. The solid black line shows the sixth-order fit to Voyager’s cloud-tracking winds (Sromovsky et al. 1993). Right: wind variations with altitude at the equator, 20°S and 70°S, both for our measurements and for a set of references in the literature (see Sect. 5 for details). Cloud-tracking winds from Fitzpatrick et al. (2014) and Tollefson & Pater (2018) are not shown at 70°S as they have uncertainties of about 1000 m s−1. Winds from Fletcher et al. (2014) do not correspond to a direct measurement, but to the computed thermal wind equation applied to a reanalysis of the 1989 IRIS/Voyager data (dashed grey lines) and to 2003 Keck data (dashed cyan lines).
Current usage metrics show cumulative count of Article Views (full-text article views including HTML views, PDF and ePub downloads, according to the available data) and Abstracts Views on Vision4Press platform.
Data correspond to usage on the plateform after 2015. The current usage metrics is available 48-96 hours after online publication and is updated daily on week days.
Initial download of the metrics may take a while.


