Fig. 6.
Download original image
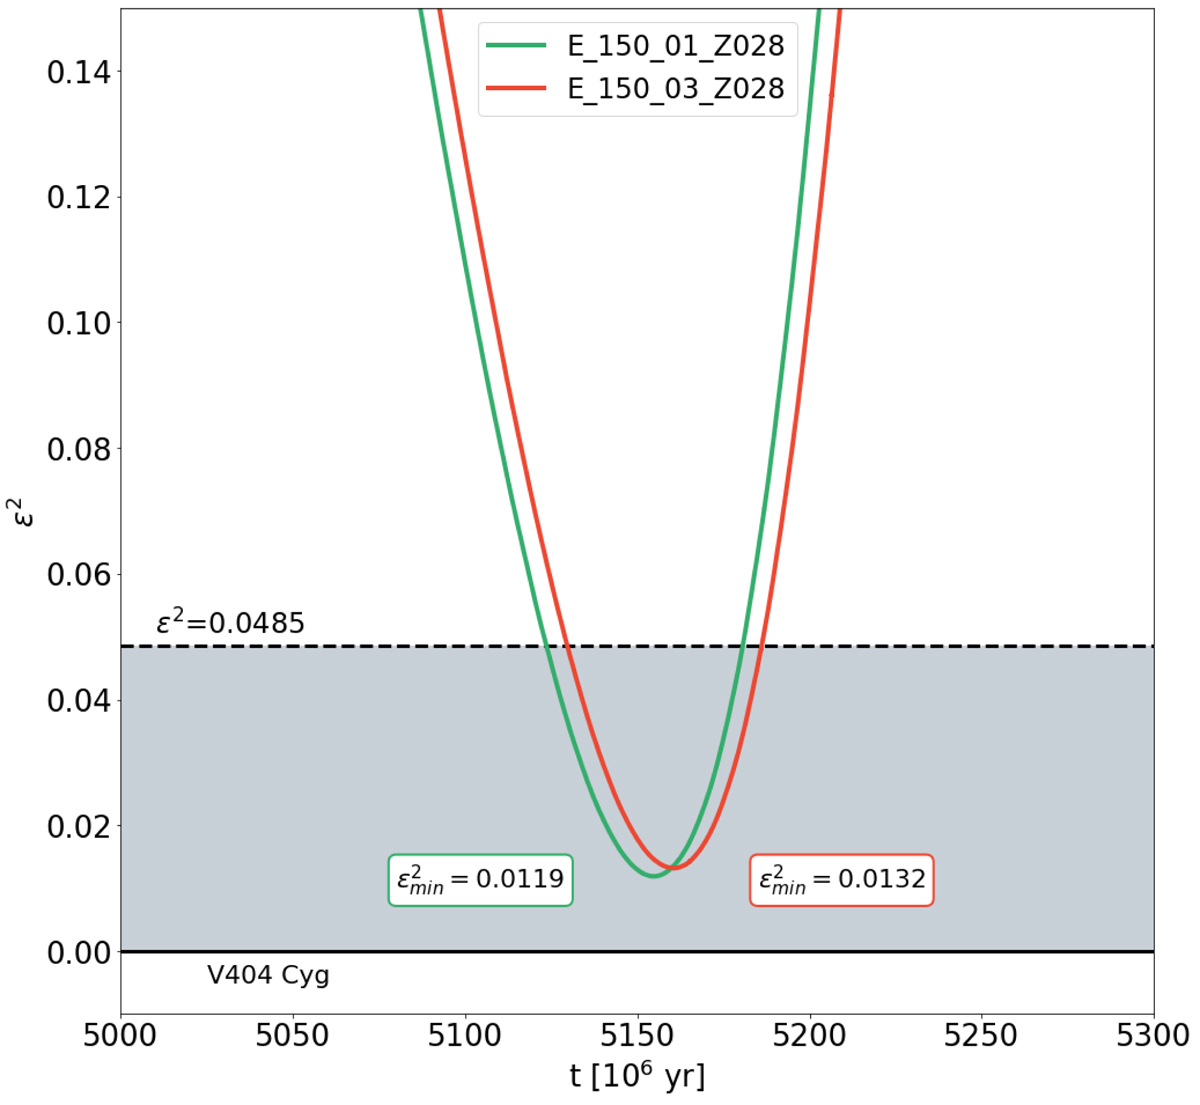
Quantity ϵ2 as a function of time for our best models with the change on metallicity: E_150_01_Z028 and E_150_03_Z028. The elements represented are the same as in Fig. 1. With a dashed line and a grey area is indicated the value of ϵ2 = 0.0485 and the acceptance region we considered for our models. With a black solid line, the value ϵ2 = 0 represents the situation where all the parameters modeled are equal to the ones observed simultaneously.
Current usage metrics show cumulative count of Article Views (full-text article views including HTML views, PDF and ePub downloads, according to the available data) and Abstracts Views on Vision4Press platform.
Data correspond to usage on the plateform after 2015. The current usage metrics is available 48-96 hours after online publication and is updated daily on week days.
Initial download of the metrics may take a while.