Fig. 2.
Download original image
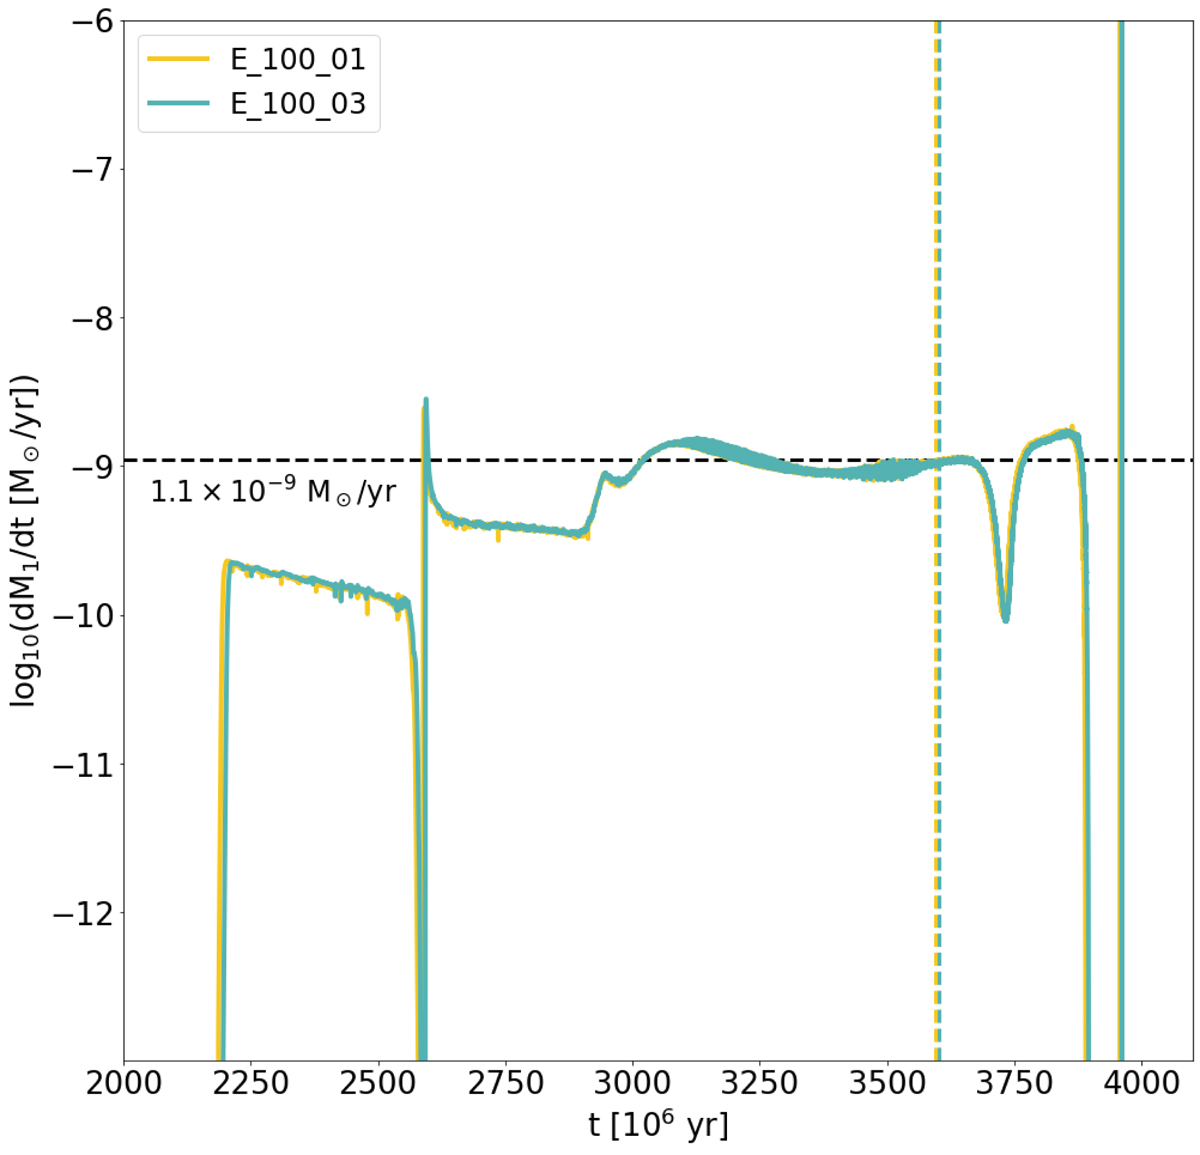
Donor star mass loss rate for each of the best models with solar composition: E_100_01 and E_100_03. As the only variation between these models is on the β value, and this parameter does not affect strongly the mass loss episode, their plots are mostly overlapping. The black dashed horizontal lines represent the estimation for the mass loss rate for V404 Cyg of Ṁd = 1.1 × 10⁻⁹ M⊙ yr−1 is denoted with a dashed horizontal line. As for the dashed vertical lines, they represent the times of the minimum value of the epsilon squared function.
Current usage metrics show cumulative count of Article Views (full-text article views including HTML views, PDF and ePub downloads, according to the available data) and Abstracts Views on Vision4Press platform.
Data correspond to usage on the plateform after 2015. The current usage metrics is available 48-96 hours after online publication and is updated daily on week days.
Initial download of the metrics may take a while.