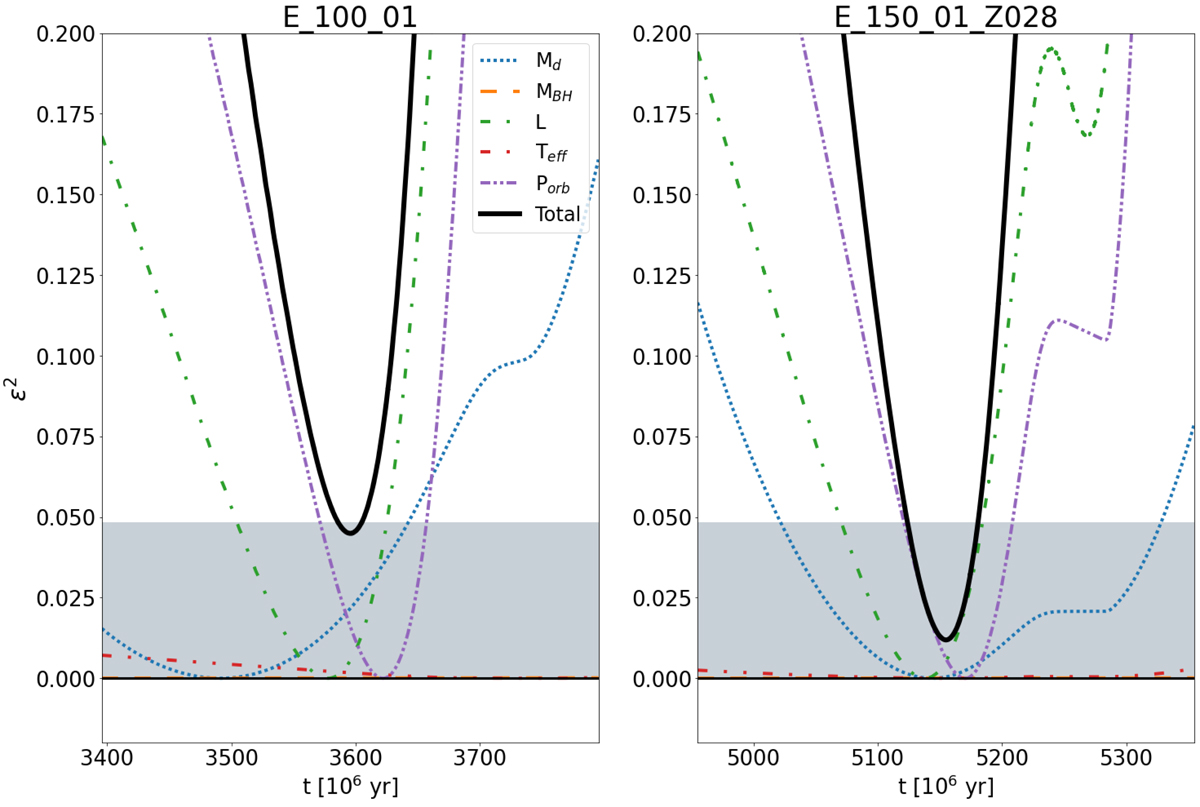
Fig. 12.
Download original image
Epsilon squared function decomposed on the contributions of every parameter analyzed for two of our models. Left: model with Z = 0.014. Right: model with Z = 0.028. The models computed with the same initial parameters except for β have similar behavior. The shaded area represents the acceptance zone, where the function takes values lower than 0.0485 and the black horizontal line at ϵ2 = 0 represents where the modeled parameter equals the observed estimation for it.
Current usage metrics show cumulative count of Article Views (full-text article views including HTML views, PDF and ePub downloads, according to the available data) and Abstracts Views on Vision4Press platform.
Data correspond to usage on the plateform after 2015. The current usage metrics is available 48-96 hours after online publication and is updated daily on week days.
Initial download of the metrics may take a while.