Fig. 11.
Download original image
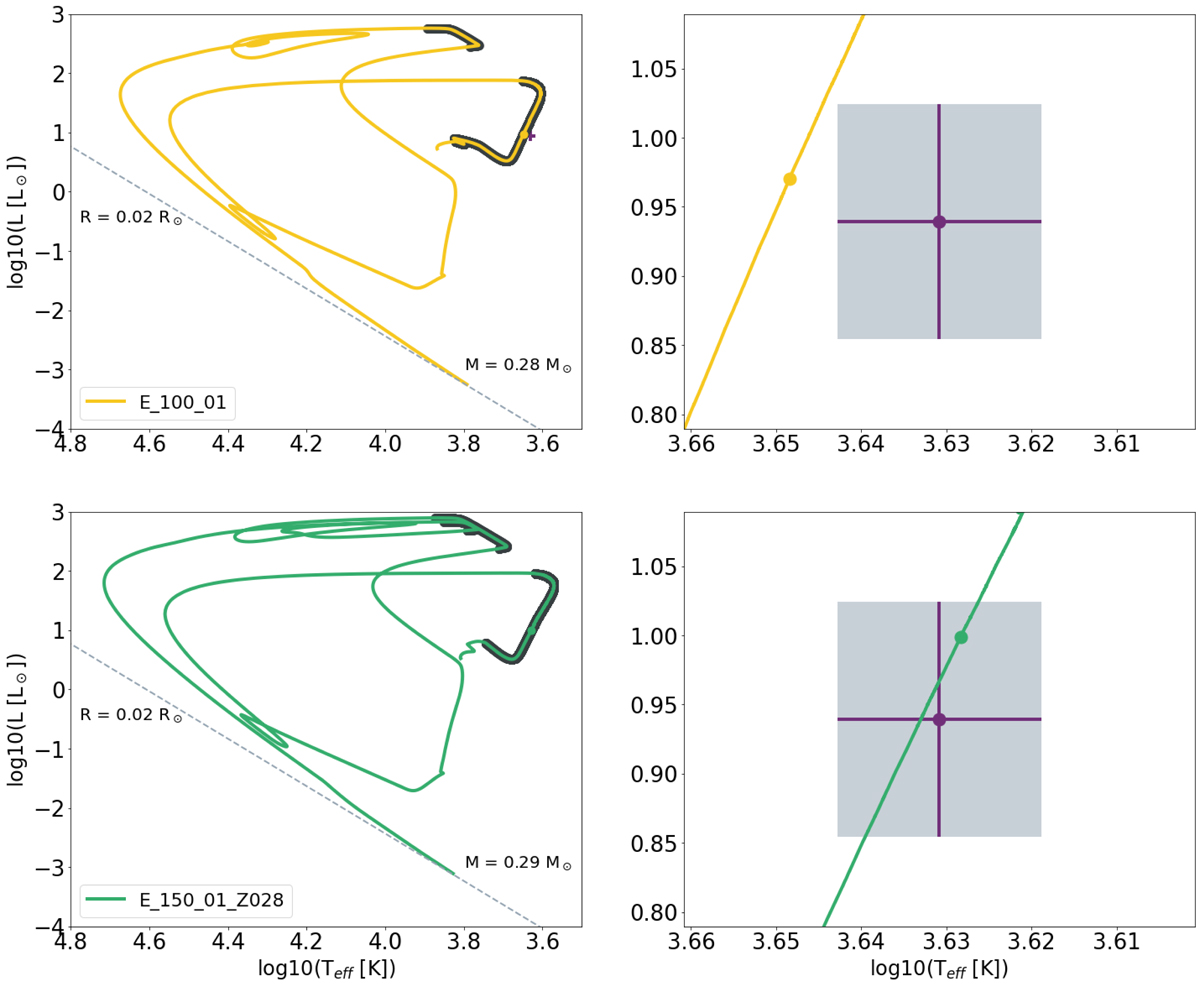
Evolutionary track in an HR diagram for two of our models. Top: model E_100_01 for the case of solar metallicity. Bottom: model E_150_01_Z028 for the case of higher metallicity. The cases of the best models with higher β value are practically overlapped with the models shown. On the left panels, the whole track is shown with a shaded area when the mass loss episode occurs. There can be seen the observationally estimated position of the donor star and the position for the age of the system predicted by our models (with circles on the evolutionary track). Once the star is getting near to becoming a white dwarf it suffers a thermonuclear flash, making it expand and lose mass again for a very short period of time. The end of these tracks are very similar, the donor becomes a low-mass white dwarf with a hydrogen-rich surface. A dashed line denoting R = 0.02 R⊙ was included; it approximately corresponds to the asymptotic radius for the white dwarf. In the right panels, the zoom is on the nearness of this estimation, where the shaded area considers the observational error for the effective temperature and luminosity.
Current usage metrics show cumulative count of Article Views (full-text article views including HTML views, PDF and ePub downloads, according to the available data) and Abstracts Views on Vision4Press platform.
Data correspond to usage on the plateform after 2015. The current usage metrics is available 48-96 hours after online publication and is updated daily on week days.
Initial download of the metrics may take a while.