Fig. 1
Download original image
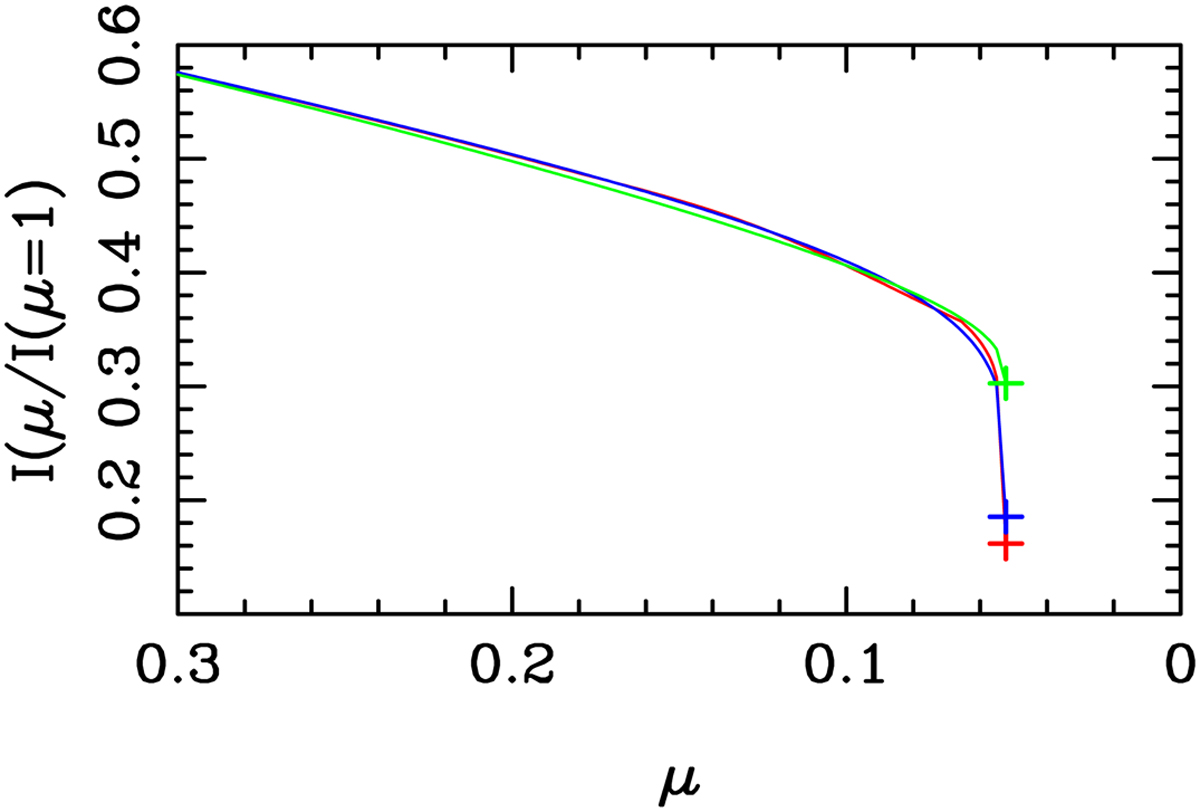
Angular distribution of the specific intensity for a model with Teff = 4500 K, log g = 4.5, [M/H] = 0.0, and Vξ = 2 km s¯1 for the TESS passband. The red line represents the specific intensity distribution and the red cross indicates µcri,1. The green line denotes the fitting adopting the power-2 law, while the green cross indicates the fitting at µcri,1. The blue line denotes the four-parameter law approach and the blue cross indicates the fitting at µcri,1. This plot is for case M1, and the specific intensity profiles have not been re-scaled.
Current usage metrics show cumulative count of Article Views (full-text article views including HTML views, PDF and ePub downloads, according to the available data) and Abstracts Views on Vision4Press platform.
Data correspond to usage on the plateform after 2015. The current usage metrics is available 48-96 hours after online publication and is updated daily on week days.
Initial download of the metrics may take a while.