Fig. 5.
Download original image
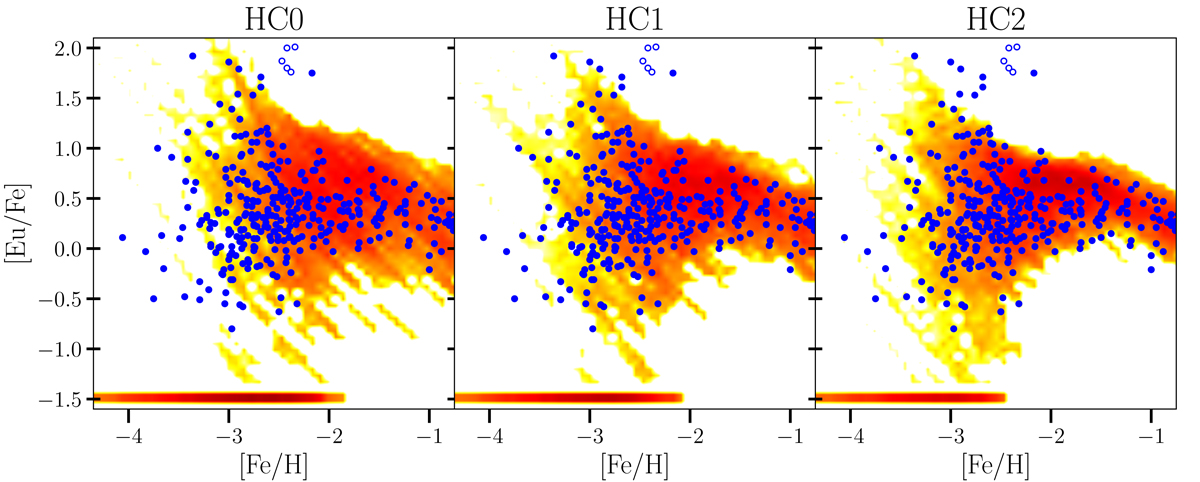
Same as Fig. 2. Left panel: results of [Eu/Fe] vs [Fe/H] for model HC0. This model is identical to model M11. We plot it again to emphasise the consequences of the variation of αNS. Central panel: same as left panel but for model HC1. In this case αNS = 0.01. To maintain constant the total amount of produced Eu, we reduce ![]() to 8.0 × 10⁻⁶ M⊙. Right panel: same as left panel but for model HC2 (αNS = 0.02 and
to 8.0 × 10⁻⁶ M⊙. Right panel: same as left panel but for model HC2 (αNS = 0.02 and ![]() = 4.0 × 10⁻⁶ M⊙).
= 4.0 × 10⁻⁶ M⊙).
Current usage metrics show cumulative count of Article Views (full-text article views including HTML views, PDF and ePub downloads, according to the available data) and Abstracts Views on Vision4Press platform.
Data correspond to usage on the plateform after 2015. The current usage metrics is available 48-96 hours after online publication and is updated daily on week days.
Initial download of the metrics may take a while.