Fig. 1.
Download original image
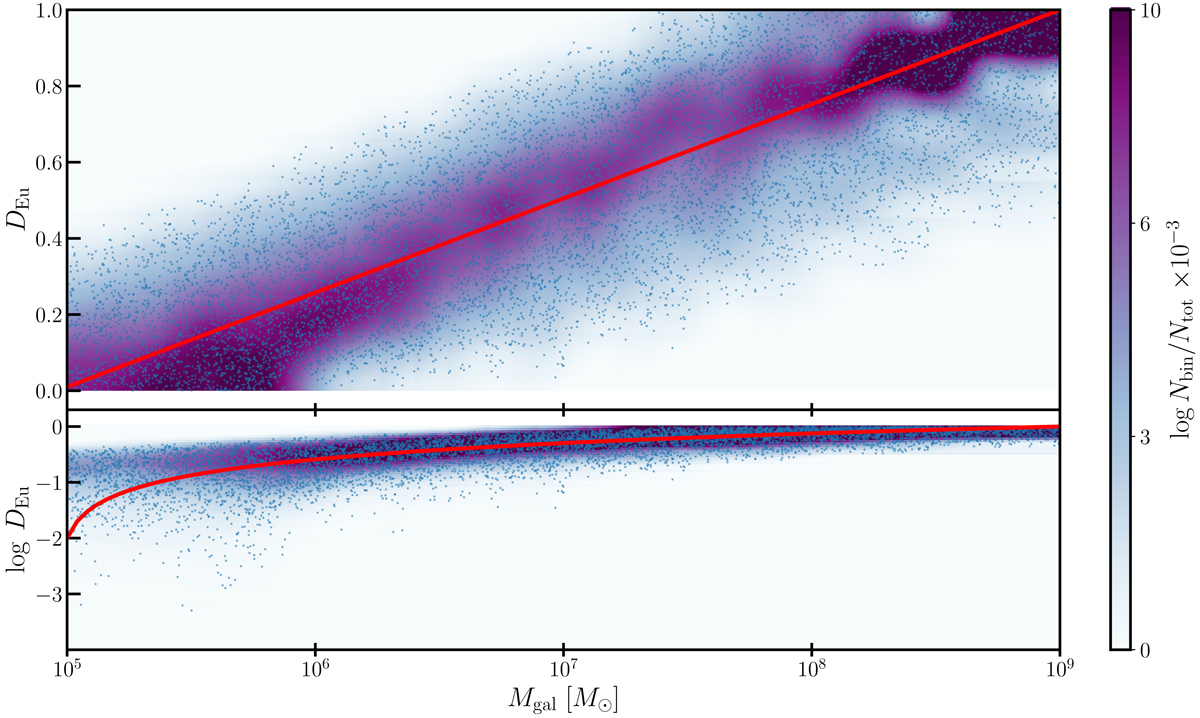
Density maps of DEu and log DEu vs Mgal planes. With the red solid line is reported the linear relation between the average value of DEu as a function of the proto-galaxy mass. With the blue dots, we report 104 random extractions of DEu. We recall that at given Mgal the values of DEu are distributed with a triangular distribution.
Current usage metrics show cumulative count of Article Views (full-text article views including HTML views, PDF and ePub downloads, according to the available data) and Abstracts Views on Vision4Press platform.
Data correspond to usage on the plateform after 2015. The current usage metrics is available 48-96 hours after online publication and is updated daily on week days.
Initial download of the metrics may take a while.