Open Access
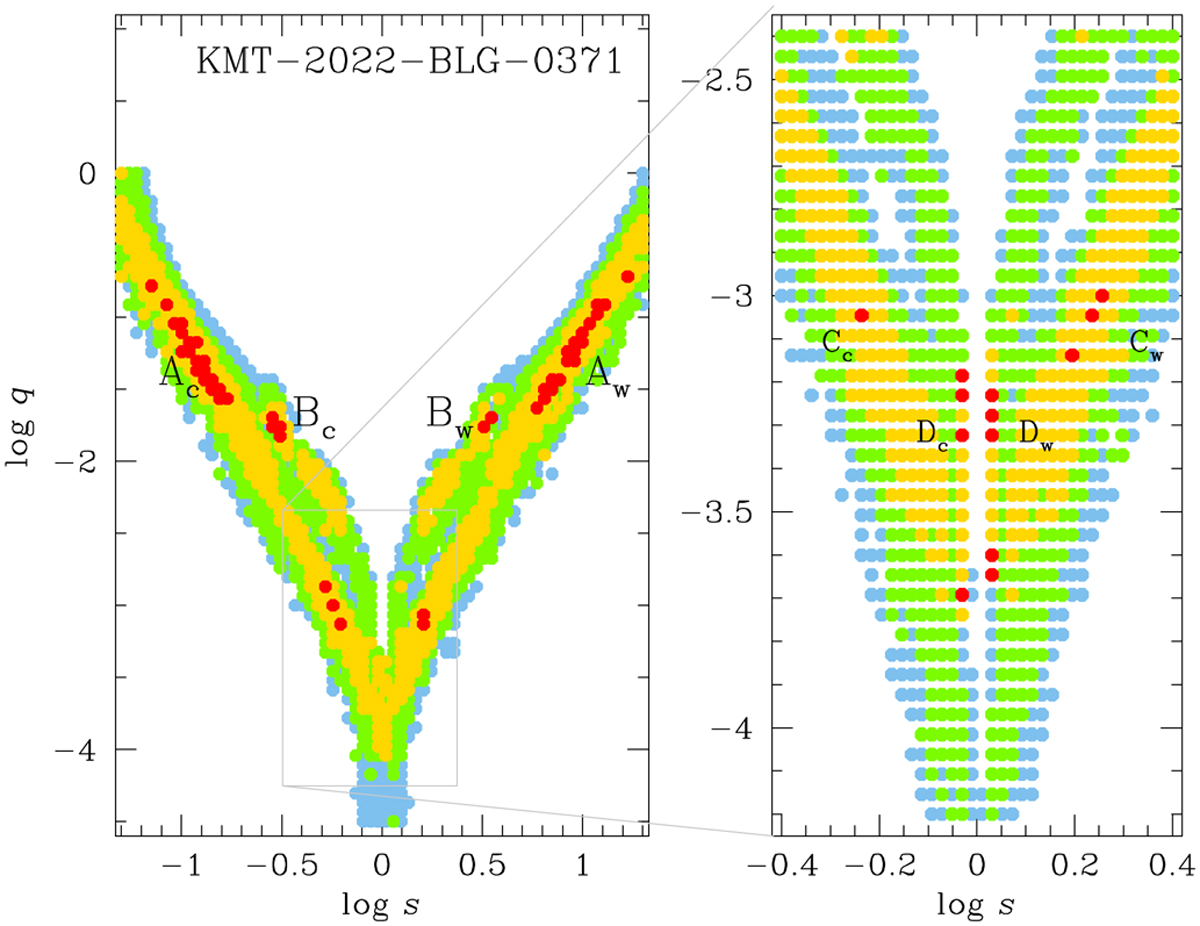
Fig. 9
Download original image
∆χ2 map constructed from the 2L1S modeling of KMT-2022-BLG-0371. The notations and color scheme of the plots are same as those of Fig. 3, except that n = 2. The locations of the four sets of local solutions are marked A, B, C, and D, and the subscripts c and w denote the close and wide solutions, respectively.
Current usage metrics show cumulative count of Article Views (full-text article views including HTML views, PDF and ePub downloads, according to the available data) and Abstracts Views on Vision4Press platform.
Data correspond to usage on the plateform after 2015. The current usage metrics is available 48-96 hours after online publication and is updated daily on week days.
Initial download of the metrics may take a while.