Open Access
Fig. 11
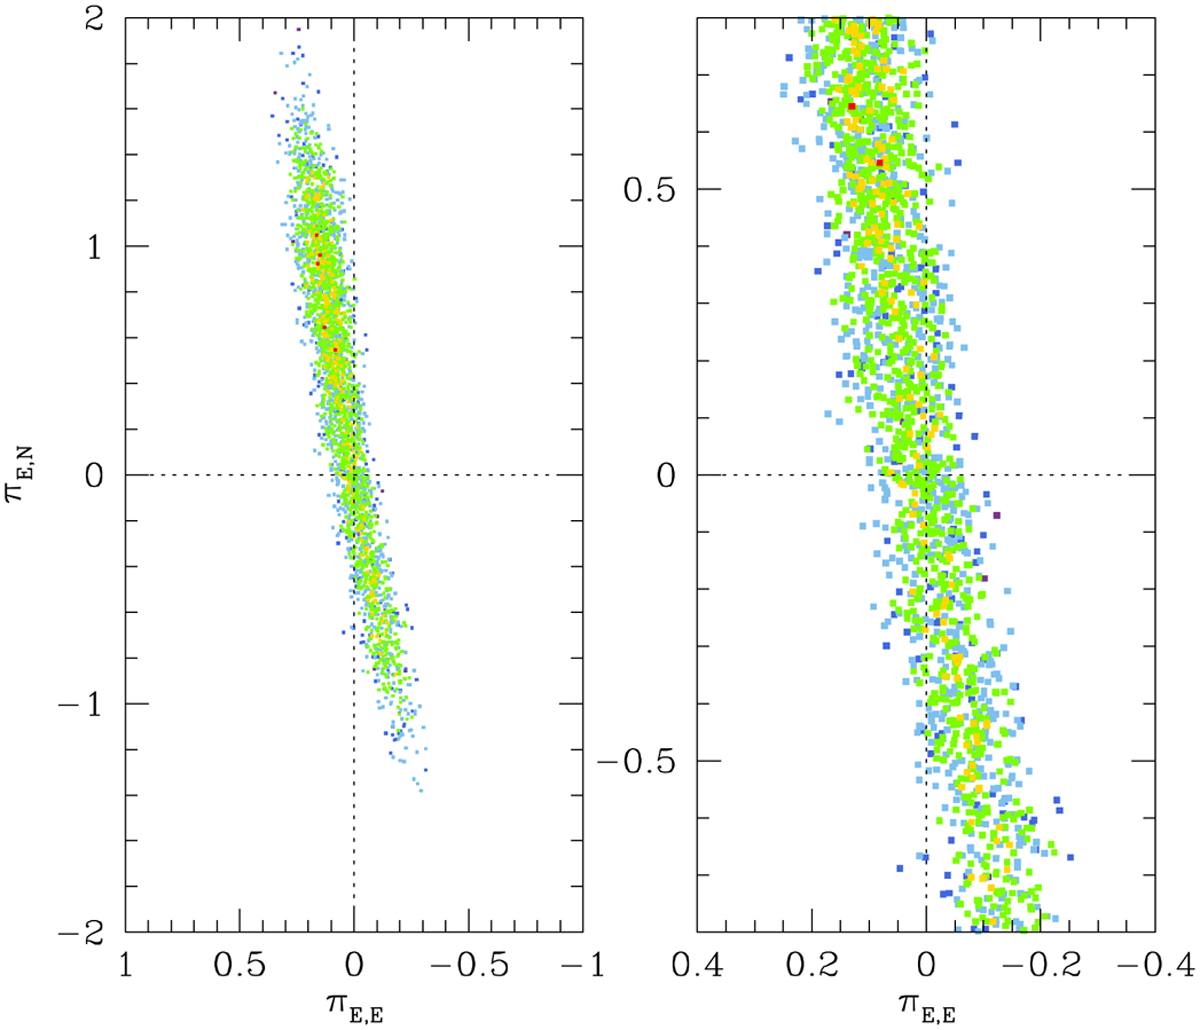
Download original image
Scatter plot of points in the MCMC chain on the πΕ,Ν−πΕ,Ε parameter plane of KMT-2022BLG-0371. The right panel shows the enlargement of the region around the origin. The color scheme of the plots is same as those of Fig. 3, except that n = 1.
Current usage metrics show cumulative count of Article Views (full-text article views including HTML views, PDF and ePub downloads, according to the available data) and Abstracts Views on Vision4Press platform.
Data correspond to usage on the plateform after 2015. The current usage metrics is available 48-96 hours after online publication and is updated daily on week days.
Initial download of the metrics may take a while.