Open Access
Fig. 9.
Download original image
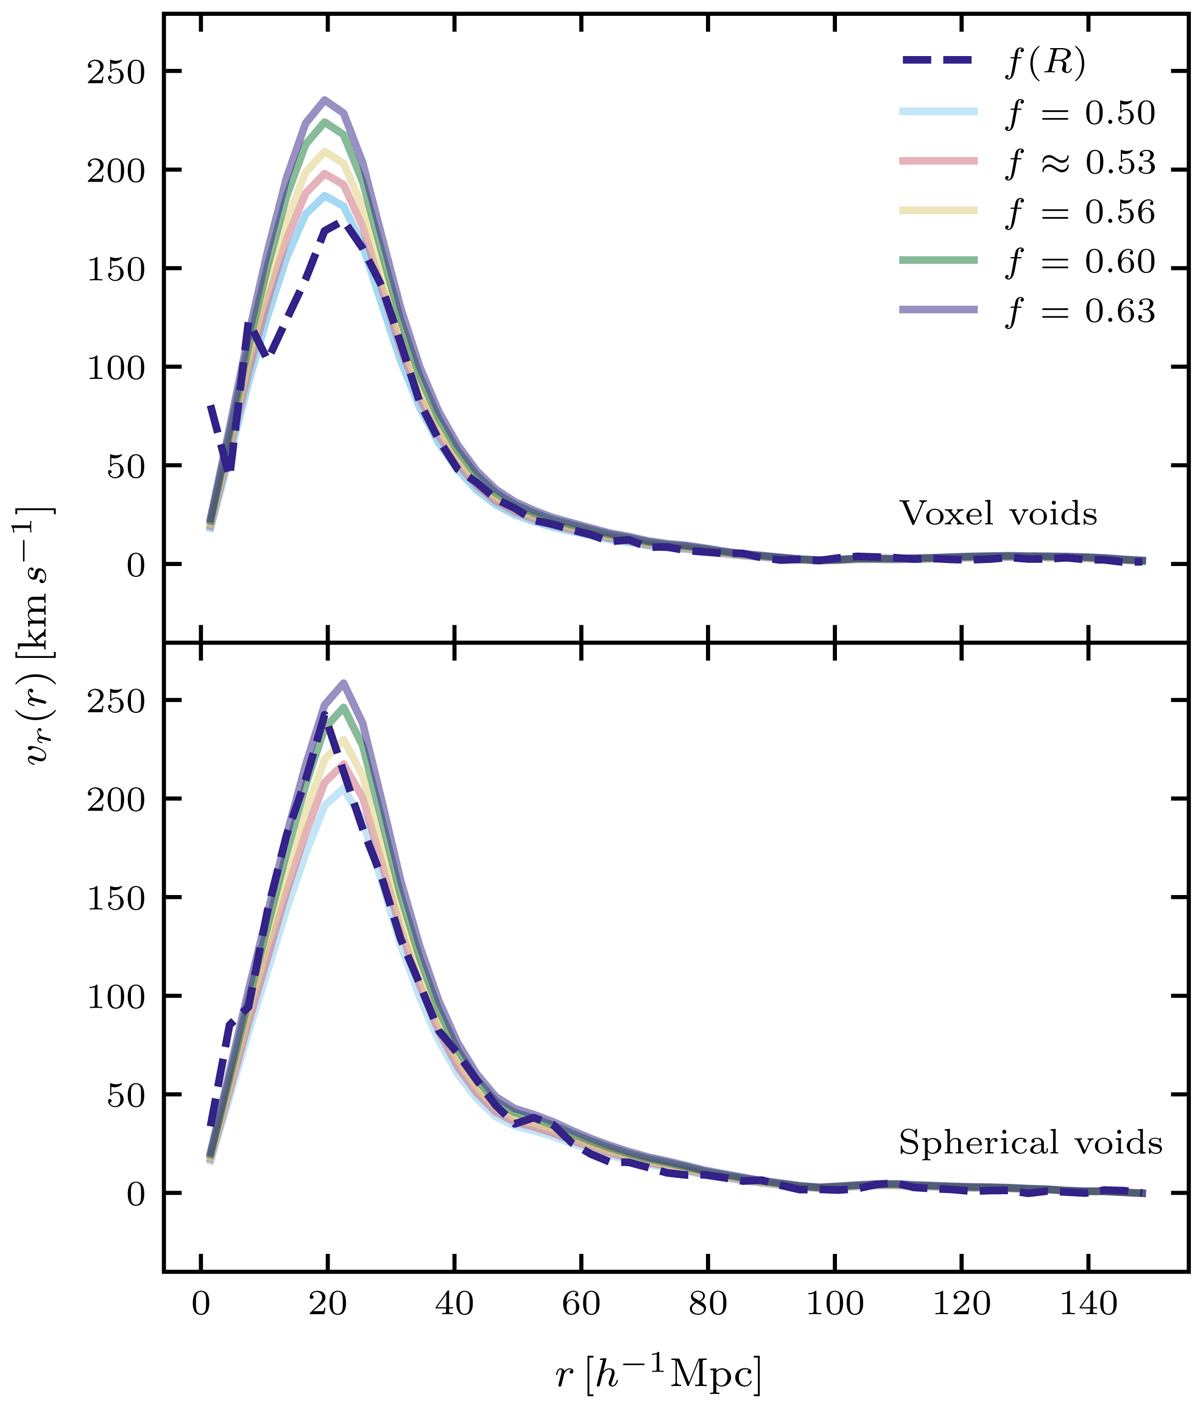
Linear velocity profile, compared to the fofr_small simulation, for various values of the growth rate, f. The regular linestyle and colour show the velocity profile for the simulation. For ΛCDM we have ![]() ≈ 0.53.
≈ 0.53.
Current usage metrics show cumulative count of Article Views (full-text article views including HTML views, PDF and ePub downloads, according to the available data) and Abstracts Views on Vision4Press platform.
Data correspond to usage on the plateform after 2015. The current usage metrics is available 48-96 hours after online publication and is updated daily on week days.
Initial download of the metrics may take a while.