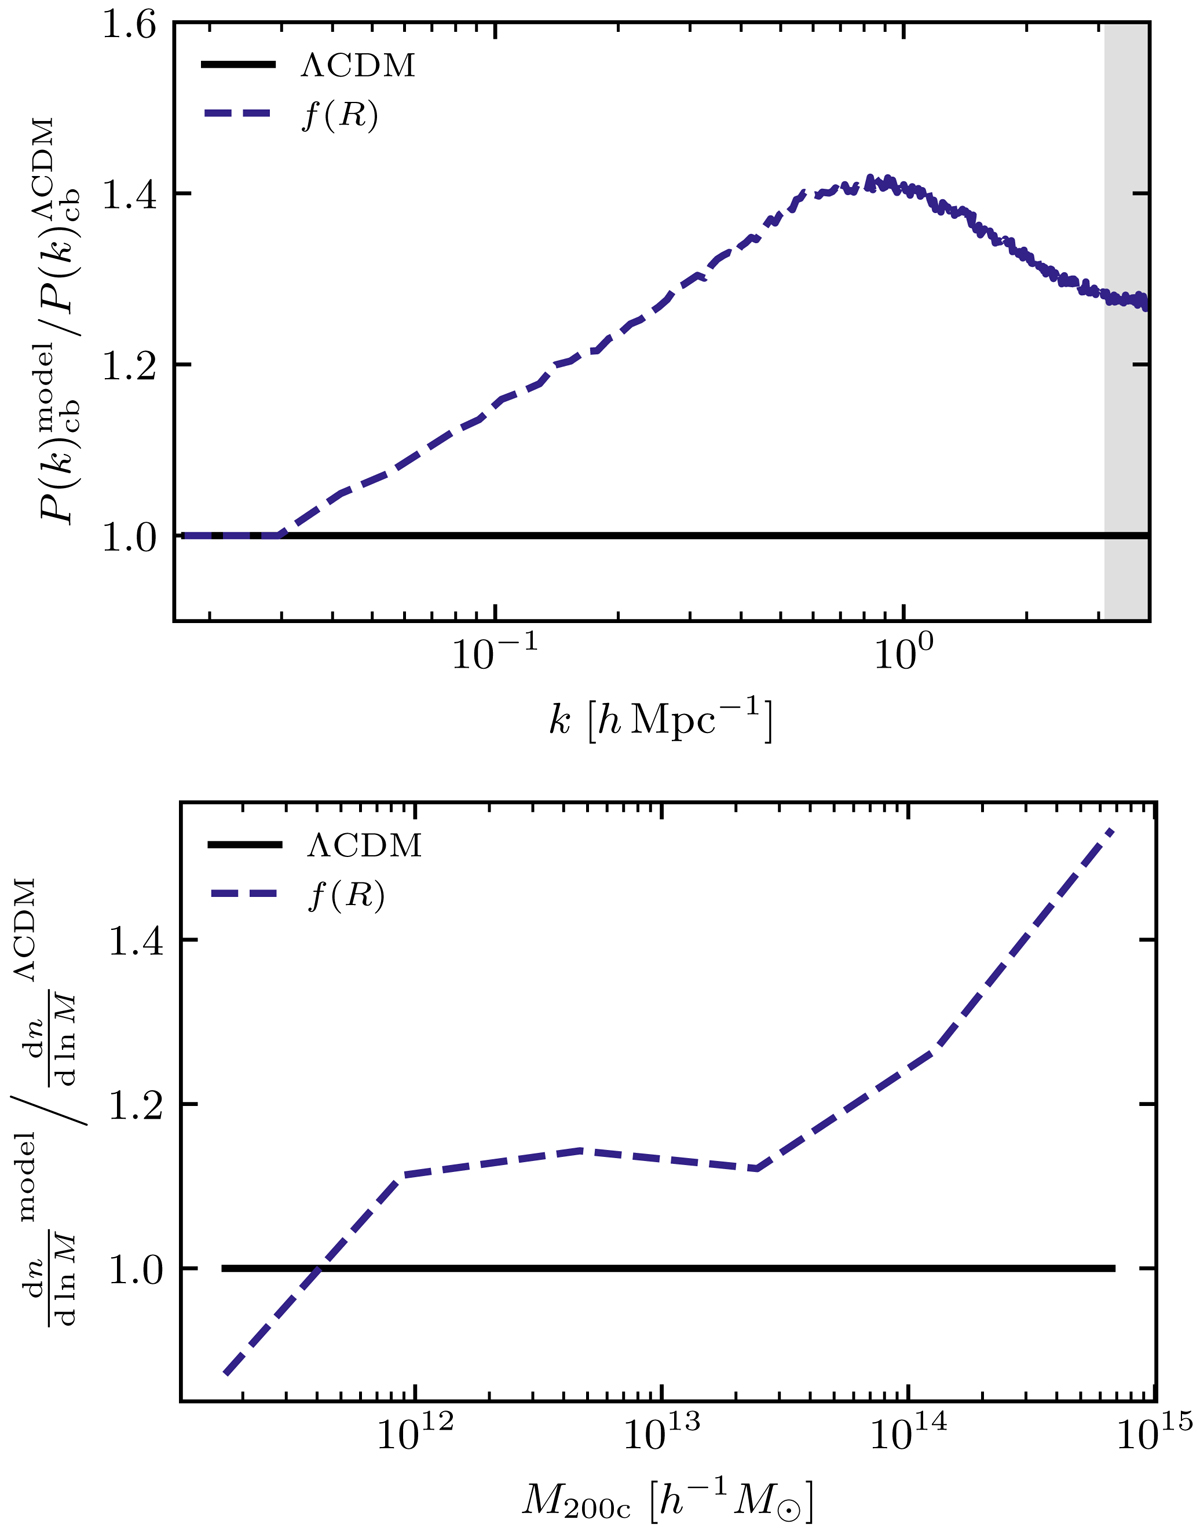
Fig. 2.
Download original image
CDM + baryon (cb) matter power spectrum and HMF of the fofr_small simulation, compared to lcdm_small. The power spectrum and HMF ratios are displayed in the top and bottom panels respectively. For the power spectrum ratio, the different σ8-values of the simulations are taken into account through scaling, and the greyed-out area indicates the parts of the ratios lying outside of the Nyquist frequency of the simulations.
Current usage metrics show cumulative count of Article Views (full-text article views including HTML views, PDF and ePub downloads, according to the available data) and Abstracts Views on Vision4Press platform.
Data correspond to usage on the plateform after 2015. The current usage metrics is available 48-96 hours after online publication and is updated daily on week days.
Initial download of the metrics may take a while.