Open Access
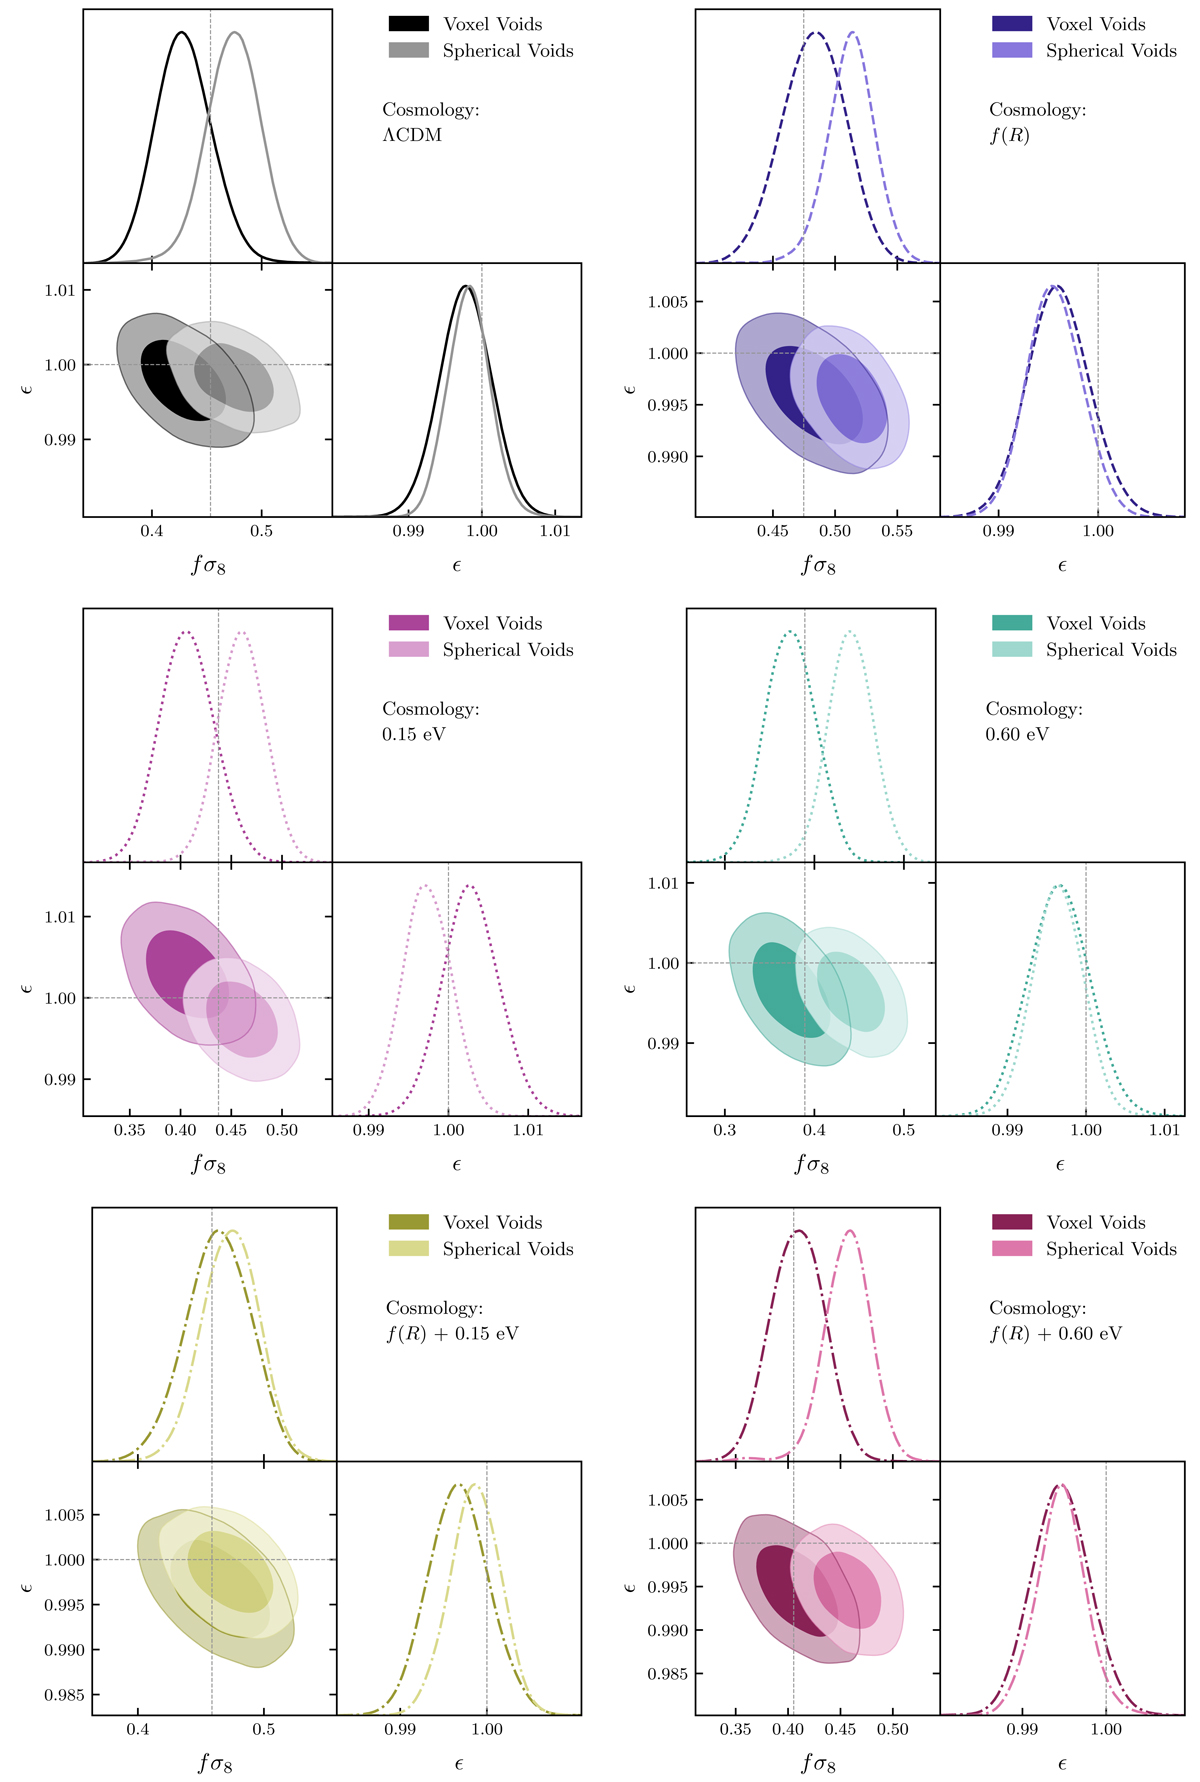
Fig. 18.
Download original image
MCMC fits for the ANUBISIS simulations. Each triangle plot shows the fσ8 and ϵ estimates of one simulation for both the voxel and spherical void definitions. The grey dashed lines show the fiducial values and the contours display the 68% and 95% confidence intervals.
Current usage metrics show cumulative count of Article Views (full-text article views including HTML views, PDF and ePub downloads, according to the available data) and Abstracts Views on Vision4Press platform.
Data correspond to usage on the plateform after 2015. The current usage metrics is available 48-96 hours after online publication and is updated daily on week days.
Initial download of the metrics may take a while.