Fig. 7.
Download original image
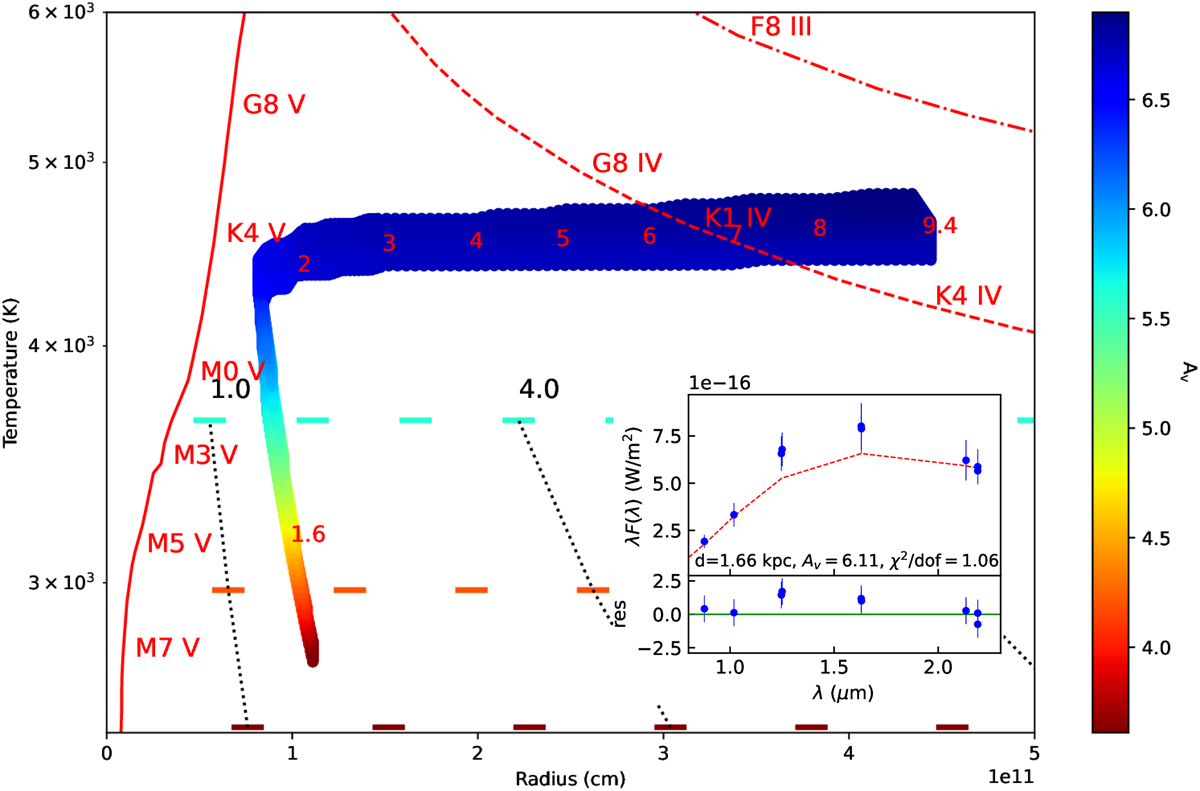
Best-fit values of effective temperature, radius, and extinction obtained from the fit of the photometric SED of J17407 (see Table 3) with an absorbed blackbody model, with two different methods. Method one: best-fit values of T and R from the fit of the photometric SED, assuming distances in the range 1–30 kpc and for three values of Av (see main text for more details). These solutions show up as three horizontal lines whose colours reflect the values assumed for Av (see vertical colour bar on the right). A grid of distances (in units of kpc) in black is overplotted. Method two: “Γ-shape” coloured area shows the best-fit parameters (![]() < 2) T and R for different values of d, where the dependency of Av on the distance is based on Green et al. (2019). For this method, the distances (in units of kpc) from 1.6 to 9.4 kpc are overplotted in red. The most relevant spectral classes for our analysis are shown in solid (main sequence), dashed (sub-giant), and dot-dashed (giant) red lines. The inset figure shows an example of a best-fitting SED (dashed red line). Blue points are the photometric measurements (see Table 3). The fit residuals (observed-model)/error are shown in the lower panel.
< 2) T and R for different values of d, where the dependency of Av on the distance is based on Green et al. (2019). For this method, the distances (in units of kpc) from 1.6 to 9.4 kpc are overplotted in red. The most relevant spectral classes for our analysis are shown in solid (main sequence), dashed (sub-giant), and dot-dashed (giant) red lines. The inset figure shows an example of a best-fitting SED (dashed red line). Blue points are the photometric measurements (see Table 3). The fit residuals (observed-model)/error are shown in the lower panel.
Current usage metrics show cumulative count of Article Views (full-text article views including HTML views, PDF and ePub downloads, according to the available data) and Abstracts Views on Vision4Press platform.
Data correspond to usage on the plateform after 2015. The current usage metrics is available 48-96 hours after online publication and is updated daily on week days.
Initial download of the metrics may take a while.