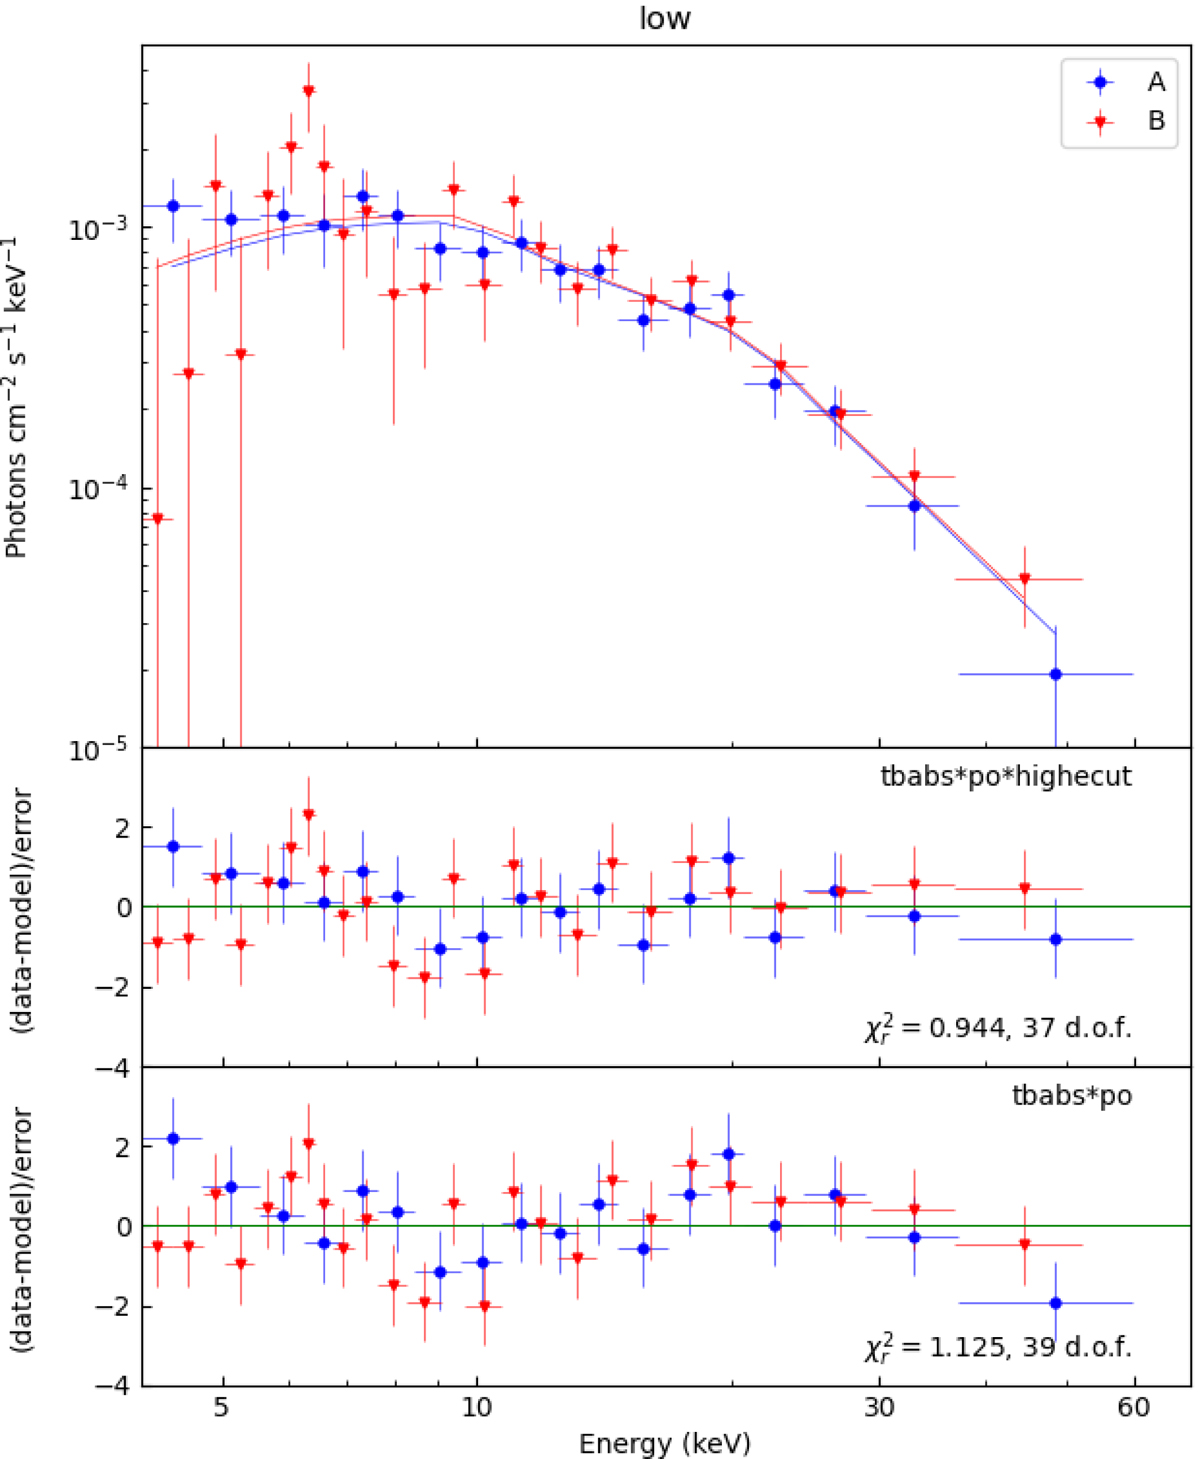
Fig. 5.
Download original image
NuSTAR (blue circles: module A; red triangles: module B) spectra of J17407 during the low luminosity state between flares (blue circles in Fig. 3). Top panel: spectra are fitted with an absorbed power law with a high-energy cutoff. Middle panel: residuals of the same fit of the top panel. Bottom panel: residuals of the fit of the spectra with an absorbed power law. See Table 2 for the best-fit parameters.
Current usage metrics show cumulative count of Article Views (full-text article views including HTML views, PDF and ePub downloads, according to the available data) and Abstracts Views on Vision4Press platform.
Data correspond to usage on the plateform after 2015. The current usage metrics is available 48-96 hours after online publication and is updated daily on week days.
Initial download of the metrics may take a while.