Fig. 3.
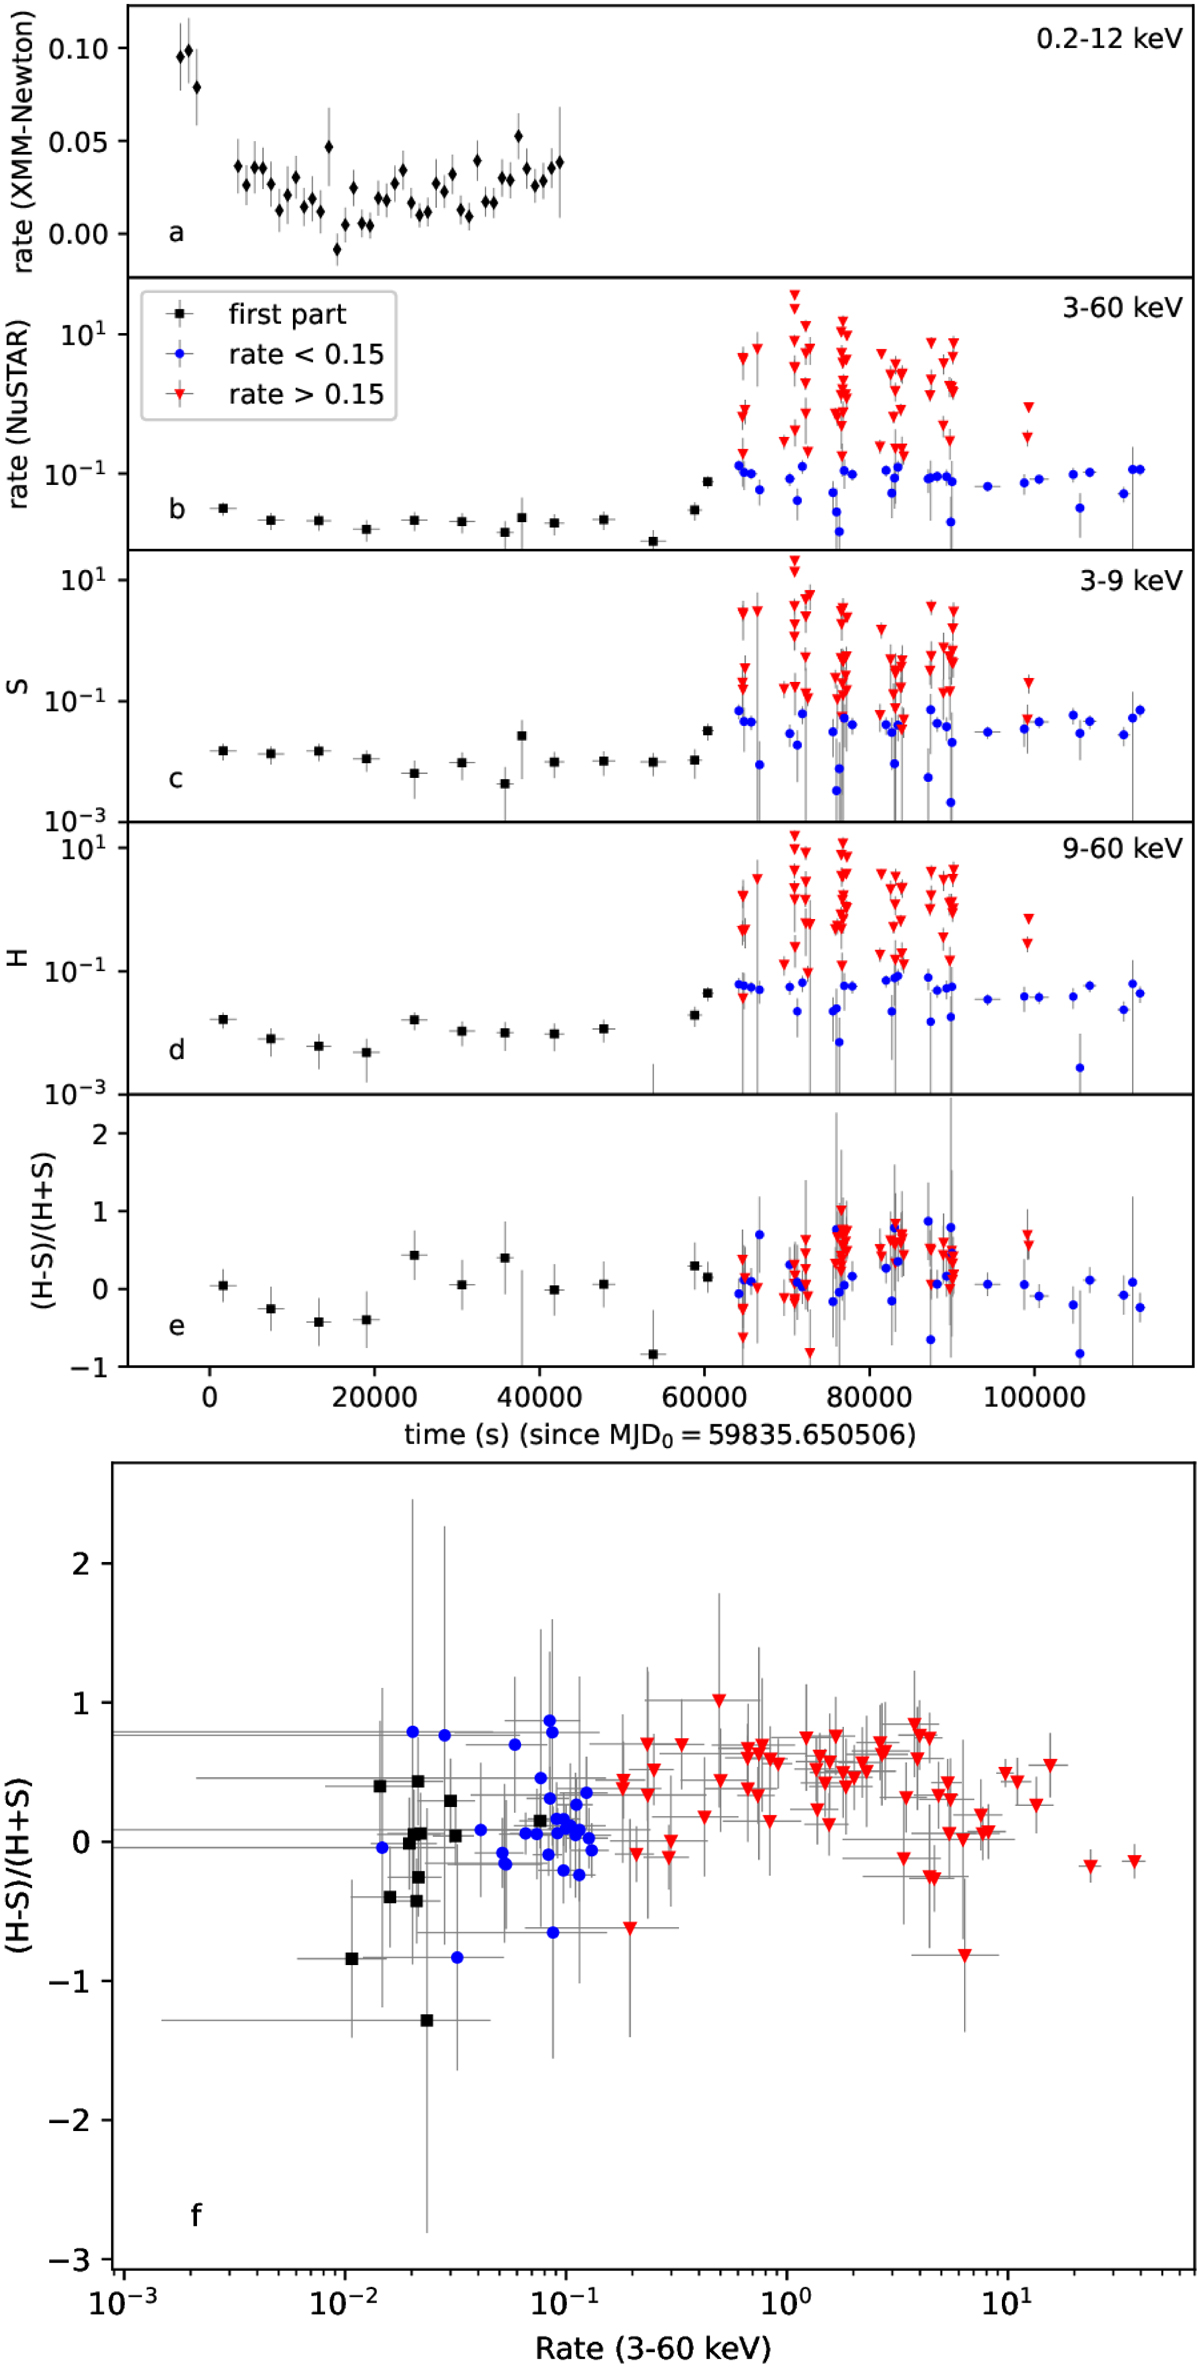
Download original image
XMM-Newton and NuSTAR light curves and HRs. Panel a: XMM-Newton/pn light curve (0.2−12 keV). Panel b: NuSTAR light curve (3−60 keV). Panel c: NuSTAR light curve in the energy band 3−9 keV. Panel d: NuSTAR light curve in the energy band 9 − 60 keV. Panel e: NuSTAR HRs as a function of time. Panel f: NuSTAR HRs as a function of rate. The first part of the light curve, where the flares are absent, is displayed in all panels with black points (diamonds for XMM-Newton, squares for NuSTAR). Flares: Red triangles. Inter-flares: Blue circles.
Current usage metrics show cumulative count of Article Views (full-text article views including HTML views, PDF and ePub downloads, according to the available data) and Abstracts Views on Vision4Press platform.
Data correspond to usage on the plateform after 2015. The current usage metrics is available 48-96 hours after online publication and is updated daily on week days.
Initial download of the metrics may take a while.